
2023 Edelman Trust Barometer

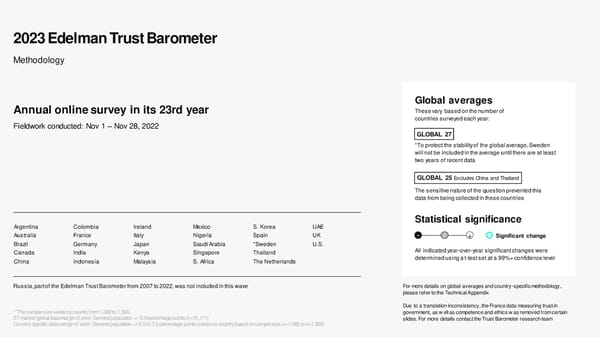
2023 Edelman Trust Barometer Methodology Global averages Annual online survey in its 23rd year These vary based on the number of countries surveyed each year: Fieldwork conducted: Nov 1 – Nov 28, 2022 GLOBAL 27 *To protect the stability of the global average, Sweden will not be included in the average until there are at least two years of recent data GLOBAL 25 Excludes China and Thailand The sensitive nature of the question prevented this data from being collected in these countries Statistical significance Argentina Colombia Ireland Mexico S. Korea UAE Australia France Italy Nigeria Spain UK - 0 + Significant change Brazil Germany Japan Saudi Arabia *Sweden U.S. Canada India Kenya Singapore Thailand All indicated year-over-year significant changes were China Indonesia Malaysia S. Africa The Netherlands determined using a t-test set at a 99%+ confidence level Russia, part of the Edelman Trust Barometer from 2007 to 2022, was not included in this wave For more details on global averages and country-specific methodology, please refer to the Technical Appendix Due to a translation inconsistency, the France data measuring trust in **The sample size varies by country from 1,082 to 1,500. government, as well as competence and ethics was removed from certain 27-market global data margin of error: General population +/-0.6 percentage points (n=31,171) slides. For more details contact the Trust Barometer research team Country-specific data margin of error: General population +/-2.5 to 3.0 percentage points (varies by country based on sample size, n=1,082 to n=1,500)
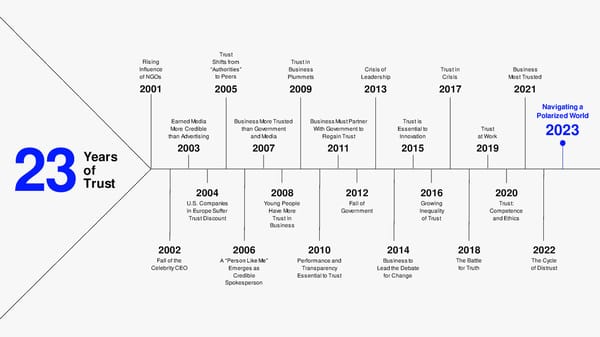
Trust Rising Shifts from Trust in Influence “Authorities” Business Crisis of Trust in Business of NGOs to Peers Plummets Leadership Crisis Most Trusted 2001 2005 2009 2013 2017 2021 Navigating a Earned Media Business More Trusted Business Must Partner Trust is Polarized World More Credible than Government With Government to Essential to Trust 2023 than Advertising and Media Regain Trust Innovation at Work Years 2003 2007 2011 2015 2019 of Trust 23 2004 2008 2012 2016 2020 U.S. Companies Young People Fall of Growing Trust: in Europe Suffer Have More Government Inequality Competence Trust Discount Trust in of Trust and Ethics Business 2002 2006 2010 2014 2018 2022 Fall of the A “Person Like Me” Performance and Business to The Battle The Cycle Celebrity CEO Emerges as Transparency Lead the Debate for Truth of Distrust Credible Essential to Trust for Change Spokesperson

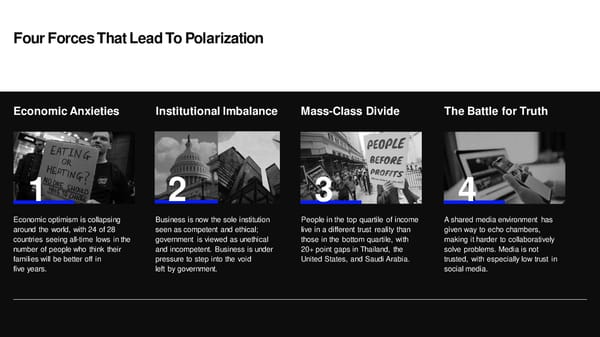
Four Forces That Lead To Polarization Economic Anxieties Institutional Imbalance Mass-Class Divide The Battle for Truth 1 2 3 4 Economic optimism is collapsing Business is now the sole institution People in the top quartile of income A shared media environment has around the world, with 24 of 28 seen as competent and ethical; live in a different trust reality than given way to echo chambers, countries seeing all-time lows in the government is viewed as unethical those in the bottom quartile, with making it harder to collaboratively number of people who think their and incompetent. Business is under 20+ point gaps in Thailand, the solve problems. Media is not families will be better off in pressure to step into the void United States, and Saudi Arabia. trusted, with especially low trust in five years. left by government. social media.


Economic Optimism Collapses Percent who say GLOBAL 24 - 0 + Significant change 24 of 28 countries at all-time lows Developed countries My family and I will be better off in five years 80 72 73 73 64 65 68 2019 2023 58 58 61 55 55 43 53 50 35 36 36 40 28 28 29 30 31 23 26 15 18 19 12 -10 9 pts Change, -6 -6 -7 -9 -10 -7 -10 -6 -11 n/a -11 -11 -20 -7 -4 -17 -13 -11 -15 -2 -22 -9 +1 -19 -6 -7 -8 -11 2022 to 2023 l l 2023 Edelman Trust Barometer. CNG_FUT. Thinking about the economic prospects for yourself and your family, how do you think you and your family will be doing in five years’ time? 5-point scale; top 2 box, better off. General population, 24-mkt avg. *Sweden is not included in the global average. Year-over-year changes were tested for significance using a t-test set at the 99%+ confidence level.
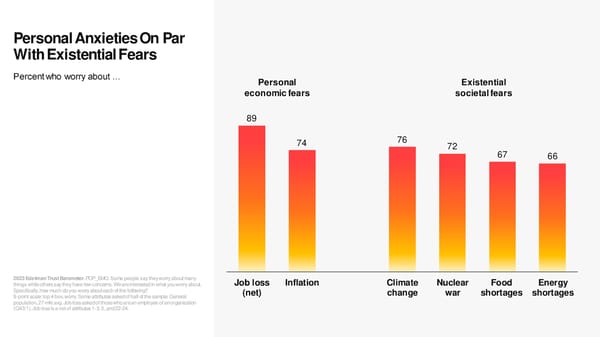
Personal Anxieties On Par With Existential Fears Percent who worry about … Personal Existential economic fears societalfears 89 74 76 72 67 66 2023 Edelman Trust Barometer. POP_EMO. Some people say they worry about many Job loss Inflation Climate Nuclear Food Energy things while others say they have few concerns. We are interested in what you worry about. Specifically, how much do you worry about each of the following? (net) change war shortages shortages 9-point scale; top 4 box, worry. Some attributes asked of half of the sample. General population, 27-mkt avg. Job loss asked of those who are an employee of an organization (Q43/1). Job loss is a net of attributes 1-3, 5, and 22-24.
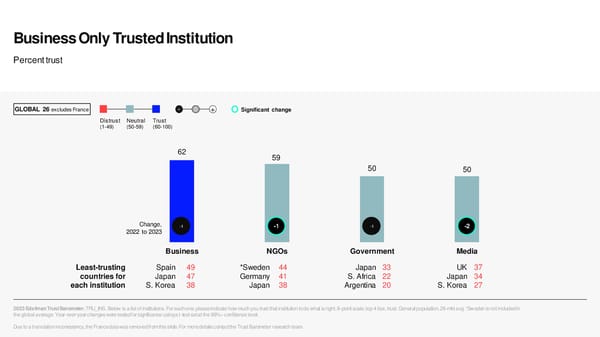
Business Only Trusted Institution Percent trust GLOBAL 26 excludes France - 0 + Significant change Distrust Neutral Trust (1-49) (50-59) (60-100) 62 59 50 50 Change, -1 -1 -1 -2 2022 to 2023 Business NGOs Government Media Least-trusting Spain 49 *Sweden 44 Japan 33 UK 37 countries for Japan 47 Germany 41 S.Africa 22 Japan 34 each institution S. Korea 38 Japan 38 Argentina 20 S. Korea 27 2023 Edelman Trust Barometer. TRU_INS. Below is a list of institutions. For each one, please indicate how much you trust that institution to do what is right.9-point scale; top 4 box, trust. General population, 26-mkt avg. *Sweden is not included in the global average. Year-over-year changes were tested for significance using a t-test set at the 99%+ confidence level. Due to a translation inconsistency, the France data was removed from this slide. For more details contact the Trust Barometerresearch team.
Government Less Trusted than Business Percent trust, and the percentage-point difference between trust in business vs government 40 Distrust Neutral Trust 32 31 (1-49) (50-59) (60-100) 28 28 24 24 12pts 15 14 14 13 13 13 11 10 9 7 5 4 4 3 1 Trust gap -3 -5 -8 -10 -14 Trust in business 62 62 52 66 68 71 64 71 71 47 68 49 50 55 57 61 54 83 52 80 38 50 52 54 84 78 73 62 Trust in government 50 22 20 35 40 43 40 47 56 33 54 36 37 42 46 51 45 76 47 76 34 47 51 57 89 86 83 76 2023 Edelman Trust Barometer. TRU_INS. Below is a list of institutions. For each one, please indicate how much you trust that institution to do what is right.9-point scale; top 4 box, trust. General population, 26-mkt avg. *Sweden is not included in the global average. Due to a translation inconsistency, the France data was removed from this slide. For more details contact the Trust Barometerresearch team.
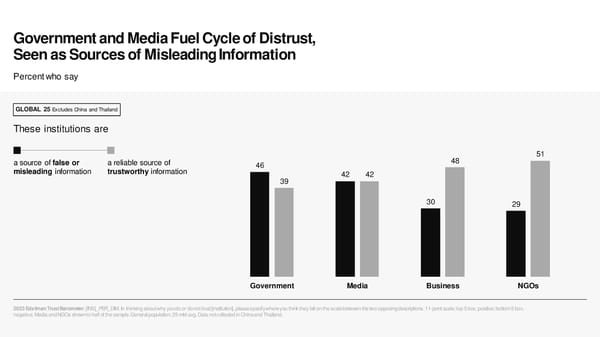
Government and Media Fuel Cycle of Distrust, Seen as Sources of Misleading Information Percent who say GLOBAL 25 Excludes China and Thailand These institutions are 48 51 a source of false or a reliable source of 46 misleading information trustworthy information 42 42 39 30 29 Government Media Business NGOs 2023 Edelman Trust Barometer. [INS]_PER_DIM. In thinking about why you do or do not trust [institution], please specify where you think they fall on the scalebetween the two opposing descriptions. 11-point scale; top 5 box, positive; bottom 5 box, negative. Media and NGOs shown to half of the sample. General population, 25-mkt avg. Data not collected in China and Thailand.
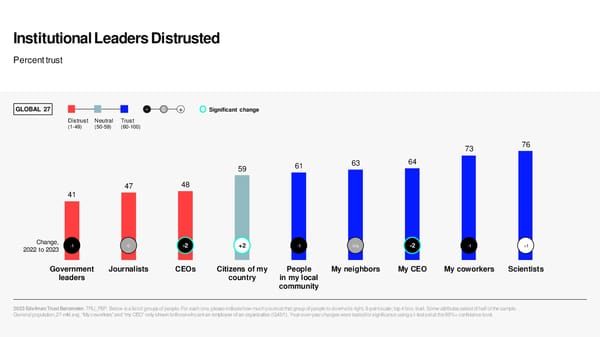
Institutional Leaders Distrusted Percent trust GLOBAL 27 - 0 + Significant change Distrust Neutral Trust (1-49) (50-59) (60-100) 73 76 59 61 63 64 47 48 41 Change, -1 0 -2 +2 -1 n/a -2 -1 +1 2022 to 2023 Government Journalists CEOs Citizens of my People My neighbors My CEO My coworkers Scientists leaders country in my local community 2023 Edelman Trust Barometer. TRU_PEP. Below is a list of groups of people. For each one, please indicate how much you trust that group of people to do what is right. 9-point scale; top 4 box, trust. Some attributes asked of half of the sample. General population, 27-mkt avg. “My coworkers” and “my CEO” only shown to those who are an employee of an organization (Q43/1). Year-over-year changes were tested for significance using a t-test set at the 99%+ confidence level.
2023 2023 High income (top 25%) Low income (bottom 25%) Mass-Class Divide: 64 Global 26 49 Global 26 90 China 71 China Income-Based Inequality 85 Thailand 70 India Creates Two Trust Realities 84 Saudi Arabia 68 Indonesia 82 Indonesia 64 Saudi Arabia 82 UAE 63 Kenya 15pts trust inequality globally; 76 India 63 UAE double-digits in 20 of 27 countries Trust Index 73 Singapore 56 Mexico (average percent trust in NGOs, business, government, and media) 70 Kenya 56 Nigeria 66 Malaysia 55 Malaysia Greatest income-based 64 Mexico 55 Singapore trust inequality in: Distrust Neutral Trust 63 U.S. 48 Brazil Thailand 37pts (1-49) (50-59) (60-100) 62 Nigeria 48 Thailand 62 The Netherlands 47 Canada U.S. 23pts 60 Germany 46 Italy 60 Ireland 46 The Netherlands Saudi Arabia 20pts 59 Italy 44 Colombia China 19pts 56 Brazil 43 Australia 54 Australia 42 Germany Japan 19pts 54 Colombia 42 Ireland 53 Canada 41 S. Africa UAE 19pts 52 S. Africa 41 *Sweden 2023 Edelman Trust Barometer. The Trust Index is the average percent trust in NGOs, 52 *Sweden 40 Spain business, government and media. TRU_INS. Below is a list of institutions. For each one, 51 UK 40 U.S. please indicate how much you trust that institution to do what is right. 9-point scale; top 4 49 Spain box, trust. General population, 26-mkt avg., by income. *Sweden is not included in the 37 Argentina global average. Due to a translation inconsistency, the France data was removed from this 48 Japan 35 UK slide. For more details contact the Trust Barometer research team. Income quartiles were determined separately for each country based on the distribution of 47 Argentina 29 Japan household incomes among respondents from that country. 44 S. Korea 29 S. Korea
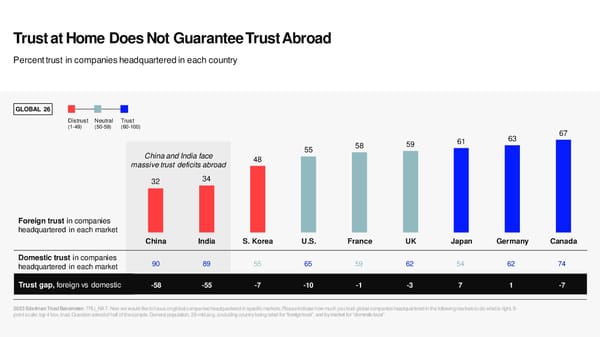
Trust at Home Does Not Guarantee Trust Abroad Percent trust in companies headquartered in each country GLOBAL 26 Distrust Neutral Trust (1-49) (50-59) (60-100) 67 58 59 61 63 China and India face 55 massive trust deficits abroad 48 32 34 Foreign trust in companies headquartered in each market China India S. Korea U.S. France UK Japan Germany Canada Domestic trust in companies 90 89 55 65 59 62 54 62 74 headquartered in each market Trust gap, foreign vs domestic -58 -55 -7 -10 -1 -3 7 1 -7 2023 Edelman Trust Barometer. TRU_NAT. Now we would like to focus on global companies headquartered in specific markets. Please indicate how much you trust global companies headquartered in the following markets to do what is right. 9- point scale; top 4 box, trust. Question asked of half of the sample. General population, 26-mkt avg., excluding country being rated for “foreign trust”, and by market for “domestic trust”.

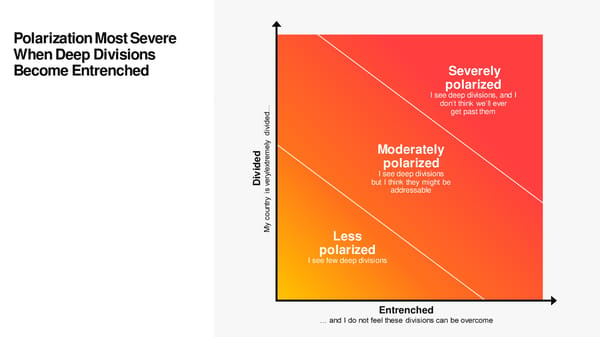
Polarization Most Severe When Deep Divisions Become Entrenched Severely polarized I see deep divisions, and I don’t think we’ll ever … get past them d e d i v i d y l e Moderately dm e er t dx polarized i e / I see deep divisions vy ir De but I think they might be v s addressable i y r t n u co y M Less polarized I see few deep divisions Entrenched … and I do not feel these divisions can be overcome
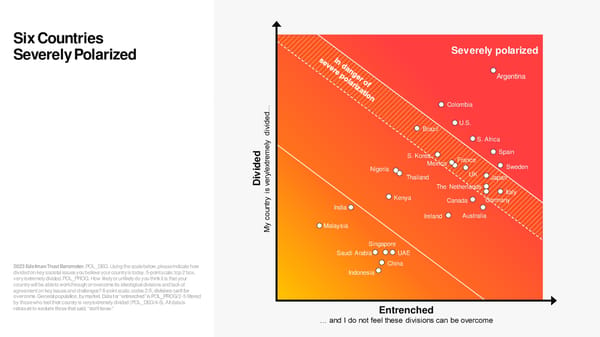
Six Countries Severely Polarized Severely polarized Argentina Colombia … d e d U.S. i v Brazil i d S. Africa y l e Spain d m S. Korea e e r France t Mexico d x Sweden i e Nigeria / v y UK i r Thailand Japan D e v The Netherlands s i Italy Kenya y Canada Germany r t n India u Ireland Australia co y Malaysia M Singapore Saudi Arabia UAE 2023 Edelman Trust Barometer. POL_DEG. Using the scale below, please indicate how China divided on key societal issues you believe your country is today. 5-point scale; top 2 box, Indonesia very/extremely divided. POL_PROG. How likely or unlikely do you think it is that your country will be able to work through or overcome its ideological divisions and lack of agreement on key issues and challenges? 8-point scale; codes 2-5, divisions can’t be overcome. General population, by market. Data for “entrenched” is POL_PROG/2-5 filtered by those who feel their country is very/extremely divided (POL_DEG/4-5). All data is rebased to exclude those that said, “don’t know.” Entrenched … and I do not feel these divisions can be overcome
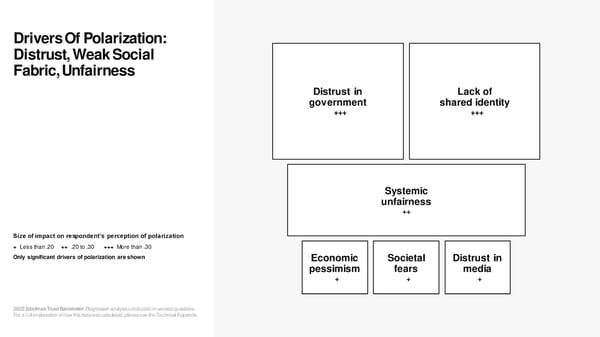
Drivers Of Polarization: Distrust, Weak Social Fabric, Unfairness Distrust in Lack of government shared identity +++ +++ Systemic unfairness ++ Size of impact on respondent’s perception of polarization + Less than .20 ++ .20 to .30 +++ More than .30 Only significant drivers of polarization are shown Economic Societal Distrust in pessimism fears media + + + 2023 Edelman Trust Barometer. Regression analysis conducted on several questions. For a full explanation of how this data was calculated, please see the Technical Appendix.
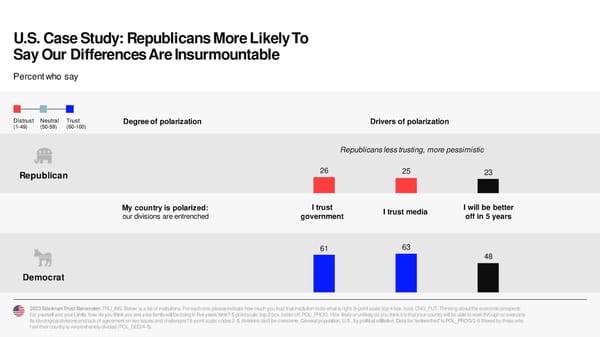
U.S. Case Study: Republicans More Likely To Say Our Differences Are Insurmountable Percent who say Distrust Neutral Trust Degree of polarization Drivers of polarization (1-49) (50-59) (60-100) Republicans less trusting, more pessimistic 26 25 23 Republicans more Republican polarized, less trusting, more pessimistic My country is polarized: I trust I trust media I will be better our divisions are entrenched government off in 5 years 61 63 48 Democrats more Democrat likely to have many societal concerns 2023 Edelman Trust Barometer. TRU_INS. Below is a list of institutions. For each one, please indicate how much you trust that institution to do what is right.9-point scale; top 4 box, trust. CNG_FUT. Thinking about the economic prospects for yourself and your family, how do you think you and your family will be doing in five years’ time? 5-point scale; top 2 box, better off. POL_PROG. How likely or unlikely do you think it is that your country will be able to work through or overcome its ideological divisions and lack of agreement on key issues and challenges? 8-point scale; codes 2-5, divisions can’t be overcome. General population, U.S., by political affiliation. Data for “entrenched” is POL_PROG/2-5 filtered by those who feel their country is very/extremely divided (POL_DEG/4-5).
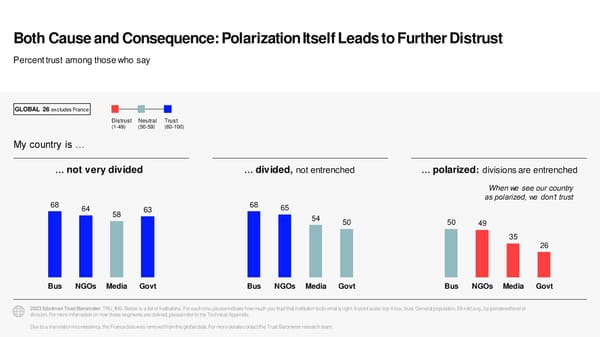
Both Cause and Consequence: Polarization Itself Leads to Further Distrust Percent trust among those who say GLOBAL 26 excludes France Distrust Neutral Trust (1-49) (50-59) (60-100) My country is … … not very divided … divided, not entrenched … polarized: divisions are entrenched When we see our country 68 68 as polarized, we don’t trust 64 58 63 65 54 50 50 49 35 26 Bus NGOs Media Govt Bus NGOs Media Govt Bus NGOs Media Govt 2023 Edelman Trust Barometer. TRU_INS. Below is a list of institutions. For each one, please indicate how much you trust that institution to do what is right.9-point scale; top 4 box, trust. General population, 26-mkt avg., by perceived level of division. For more information on how these segments are defined, please refer to the Technical Appendix. Due to a translation inconsistency, the France data was removed from the global data. For more details contact the Trust Barometer research team.
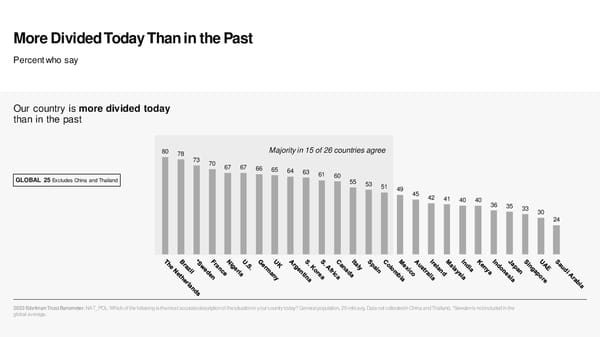
More Divided Today Than in the Past Percent who say Our country is more divided today than in the past 80 78 Majority in 15 of 26 countries agree 73 70 67 67 66 65 64 63 GLOBAL 25 Excludes China and Thailand 61 60 55 53 51 49 45 42 41 40 40 36 35 33 30 24 2023 Edelman Trust Barometer. NAT_POL. Which of the following is the most accurate description of the situation in your country today? General population, 25-mkt avg. Data not collected in China and Thailand. *Sweden is not included in the global average.
Divisive Forces Exploit and Intensify Our Differences Percent who say GLOBAL 25 Excludes China and Thailand These groups are Business leaders, NGO leaders, and teachers more likely to be seen as unifiers a dividing force a unifying force that pulls people apart that brings people together 62 61 64 49 46 43 41 33 35 32 29 20 22 20 Rich and Hostile foreign Government Journalists Business NGO leaders Teachers powerful governments leaders leaders 2023 Edelman Trust Barometer. PROB_PLP. Ideological differences will always exist among people, but there are some groups of people that are perhaps making things worse than they might otherwise be by fueling divisions and fomenting a lack of civility between people who hold different views. In contrast, there are some groups of people that are perhaps making thingsbetter than they might otherwise be by working to foster cooperation between people who hold different views. In thinking about each group of people listed below, please specify where you think they fall on the scale between being a unifying forcein society and being a dividing force. 11-point scale; codes 7-11, a dividing force in society; codes 1-5, a unifying force in society. Some attributes asked of half of the sample. General population, 25-mkt avg. ”Journalists” and “Government leaders” not asked in China and Thailand.
Social Fabric Weakens Percent who say GLOBAL 27 The lack of civility and mutual respect The social fabric that once held this country today is the worst I have ever seen together has grown too weak to serve as a foundation for unity and common purpose 2023 Edelman Trust Barometer. POP_MDC. Below is a list of statements. For each one, please rate how true you believe that statement is using a nine-point scale where one means it is “not at all true” and nine means it is “completely true”. 9-point scale; top 4 box, true. General population, 27-mkt avg.
Ideology Becomes Identity: Few Would Help, Live, or Work With the Other Side Among those who feel strongly about an issue, percent who say GLOBAL 27 If a person strongly disagreed with me or my point of view, I would … Help them Be willing to live in Be willing to have them if they were in need the same neighborhood as a coworker 2023 Edelman Trust Barometer. ISS_DIF_CONS. Thinking about the issue you just selected, which of the following describes how you would feel about, or act towards, a person who strongly disagreed with your position or point of view on that issue? Pick all that apply. Question asked among those who feel strongly about an issue (PERS_ISS/1-5). General population, 27-mkt avg.
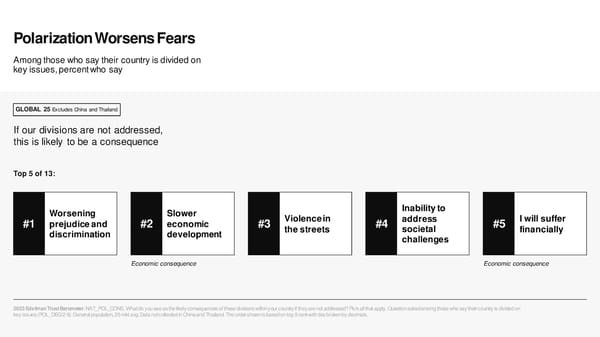
Polarization Worsens Fears Among those who say their country is divided on key issues, percent who say GLOBAL 25 Excludes China and Thailand If our divisions are not addressed, this is likely to be a consequence Top 5 of 13: Worsening Slower Inability to #1 prejudice and #2 economic #3 Violence in #4 address #5 I will suffer discrimination development the streets societal financially challenges Economic consequence Economic consequence 2023 Edelman Trust Barometer. NAT_POL_CONS. What do you see as the likely consequences of these divisions within your country if they are not addressed? Pick all that apply. Question asked among those who say their country is divided on key issues (POL_DEG/2-5). General population, 25-mkt avg. Data not collected in China and Thailand. The order shown is based on top 5 rank with ties broken by decimals.

Only Business is 2023 Ethical Competent and Ethical; 2020 Sustains Rise in Ethics for Third Year NGOs (-3, 22) (Competence score, net ethical score) Business (11, 18) 2022 GLOBAL 23 Excludes China and Thailand 2020 to 2023: +19pts in ethics 2021 Less competent Competent (14, -1) Government Media (-42, -11) (-23, -8) 2023 Edelman Trust Barometer. The ethical scores are averages of nets based on [INS]_PER_DIM/1-4. Government and Media were only asked of half of the sample. The competence score is a net based on TRU_3D_[INS]/1. Government and Media were only asked of half of the sample. General population, 23-mkt avg. Data not collected in China and Thailand. For full details regarding how this data was calculated and plotted, please see the Technical Appendix. Due to a translation inconsistency, the France data was removed from this Unethical slide. For more details contact the Trust Barometer research team.
Employers Among Those Who Feel Polarized, Most Trusted Employer Is Only Trusted Institution Percent trust Percent trust among those who say their country is … GLOBAL 26 excludes France Distrust Neutral Trust (1-49) (50-59) (60-100) not very divided divided, polarized: My employer not entrenched divisions are entrenched My employer 78 81 82 69 Business 62 68 68 50 NGOs 59 64 65 49 Government 50 63 50 26 Media 50 58 54 35 2023 Edelman Trust Barometer. TRU_INS. Below is a list of institutions. For each one, please indicate how much you trust that institution to do what is right.9-point scale; top 4 box, trust. General population, 26-mkt avg., and by perceived level of division. “Your employer” only shown to those who are an employee of an organization (Q43/1). Due to a translation inconsistency, the France data was removed from the global data. For more details contact the Trust Barometer research team.
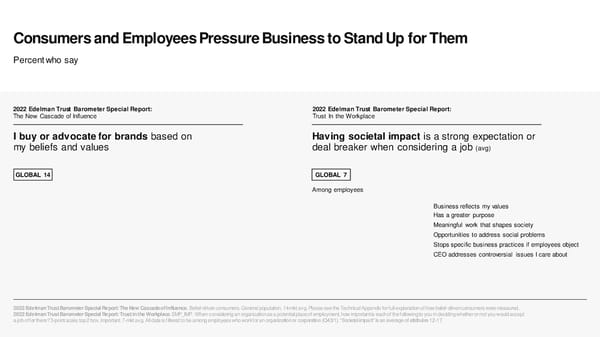
Consumers and Employees Pressure Business to Stand Up for Them Percent who say 2022 Edelman Trust Barometer Special Report: 2022 Edelman Trust Barometer Special Report: The New Cascade of Influence Trust In the Workplace I buy or advocate for brands based on Having societal impact is a strong expectation or my beliefs and values deal breaker when considering a job (avg) GLOBAL 14 GLOBAL 7 Among employees Business reflects my values Has a greater purpose Meaningful work that shapes society Opportunities to address social problems Stops specific business practices if employees object CEO addresses controversial issues I care about 2022 Edelman Trust Barometer Special Report: The New Cascade of Influence. Belief-driven consumers. General population, 14-mkt avg. Please see the Technical Appendix for full explanation of how belief-driven consumers were measured. 2022 Edelman Trust Barometer Special Report: Trust in the Workplace. EMP_IMP. When considering an organization as a potential place of employment, how important is each of the following to you in deciding whether or not you would accept a job offer there? 3-point scale; top 2 box, important. 7-mkt avg. All data is filtered to be among employees who work for an organization or corporation (Q43/1). “Societal impact” is an average of attributes 12-17.
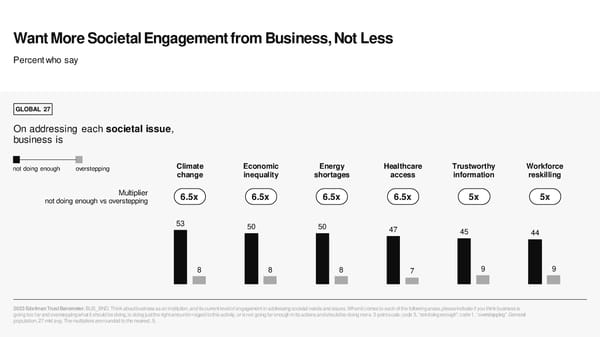
Want More Societal Engagement from Business, Not Less Percent who say GLOBAL 27 On addressing each societal issue, business is not doing enough overstepping Climate Economic Energy Healthcare Trustworthy Workforce change inequality shortages access information reskilling Multiplier 6.5x 6.5x 6.5x 6.5x 5x 5x not doing enough vs overstepping 53 50 50 47 45 44 8 8 8 7 9 9 2023 Edelman Trust Barometer. BUS_BND. Think about business as an institution, and its current level of engagement in addressing societal needs and issues.When it comes to each of the following areas, please indicate if you think business is going too far and overstepping what it should be doing, is doing just the right amount in regard to this activity, or is not going far enough in its actions and should be doing more. 3-point scale; code 3, “not doing enough”; code 1, “overstepping”. General population, 27-mkt avg. The multipliers are rounded to the nearest .5.
Societal Engagement Puts Business at Risk of Being Politicized Percent who agree I think business can avoid being political when it addresses contentious societal issues At risk of becoming Severely severely polarized polarized 64 65 65 69 Less than majority agree in 19 of 28 countries 56 60 61 53 55 43 43 43 44 45 46 46 47 48 48 48 38 38 41 30 33 34 35 35 2023 Edelman Trust Barometer. ENG_ISS. Do you agree or disagree with the following statement: It is possible for a business to engage in addressing contentious societal issues in ways that I would not consider to be political or politically motivated. 9-point scale; top 4 box, agree. General population, 27-mkt avg.

CEOs Most Expected To Act on Employees, Climate, and Discrimination Percent who say I expect CEOs to take a public stand on this issue: GLOBAL 27 Treatment of employees 89 Climate change 82 Discrimination 80 Wealth gap 77 Immigration 72 2023 Edelman Trust Barometer. CEO_ISS_EXP. For each of the following issues, please indicate what you expect CEOs to do. 3-point scale; code 1, publicly take a stand; code 2, take a stand and use resources. Question asked of half of the sample. General population, 27-mkt avg. Data is rebased to exclude those that said, “don’t know,” and showing the sum of codes 1 and 2.
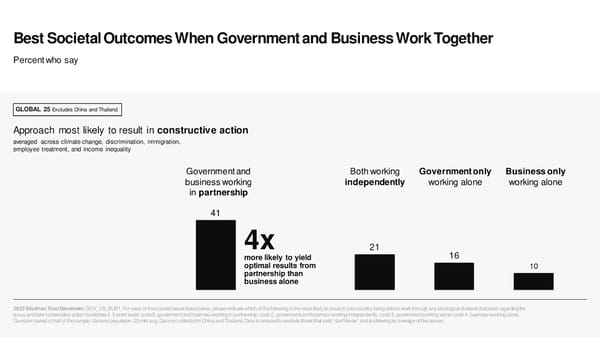
Best Societal Outcomes When Government and Business Work Together Percent who say GLOBAL 25 Excludes China and Thailand Approach most likely to result in constructive action averaged across climate change, discrimination, immigration, employee treatment, and income inequality Government and Both working Government only Business only business working independently working alone working alone in partnership 41 4x 21 more likely to yield 16 optimal results from 10 partnership than business alone 2023 Edelman Trust Barometer. GOV_VS_BUS1. For each of the societal issues listed below, please indicate which of the following is the most likely to result in your country being able to work through any ideological divisions that exist regarding the issue and take constructive action to address it. 5-point scale; code 5, government and business working in partnership; code 2, government and business working independently; code 3, government working alone; code 4, business working alone. Question asked of half of the sample. General population, 25-mkt avg. Data not collected in China and Thailand. Data is rebased to exclude those that said, “don’t know” and is showing an average of five issues.
Trustworthy Information Insulates Business Action from Politicization Among the 48% who say it is possible for a business to address societal issues without being seen as politicized, percent who say To avoid being seen as politically motivated when taking a stand: GLOBAL 27 Be a trustworthy information source 46 Base actions on science 43 Don’t align with only one political party 39 Act on same values over time 36 Link actions to staying competitive 33 2023 Edelman Trust Barometer. ENG_ISS_HOW. You just said that it is possible for a business to engage in addressing contentious societal issues in ways that you would not consider to be political or politically motivated. Which of the following would be ways that a company could do that? Pick all that apply. Question asked among those who said it is possible for a business to engage in addressing issues that would not be considered political (ENG_ISS/6-9). General population, 27-mkt avg.
Improve Economic Optimism: Invest in Fair Compensation, Local Communities, Skills Training Percent who say CEOs are obligated to … GLOBAL 27 Pay a fair wage 84 Ensure their home community is safe and thriving 79 Pay fair corporate taxes 78 Retrain employees 78 2023 Edelman Trust Barometer. CEO_PLAY_BK. How obligated do you believe CEOs are to take the following actions? 5-point scale; top 3 box, obligated. Attributes shown to half of the sample. General population, 27-mkt avg.
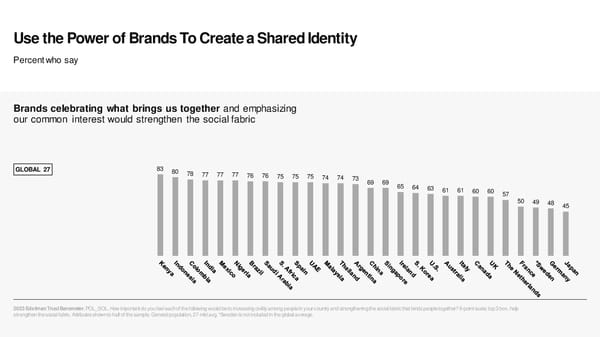
Use the Power of Brands To Create a Shared Identity Percent who say Brands celebrating what brings us together and emphasizing our common interest would strengthen the social fabric GLOBAL 27 83 80 78 77 77 77 76 76 75 75 75 74 74 73 69 69 65 64 63 61 61 60 60 57 50 49 48 45 2023 Edelman Trust Barometer. POL_SOL. How important do you feel each of the following would be to increasing civility among people in your country and strengthening the social fabric that binds people together? 6-point scale; top 3 box, help strengthen the social fabric. Attributes shown to half of the sample. General population, 27-mkt avg. *Sweden is not included inthe global average.
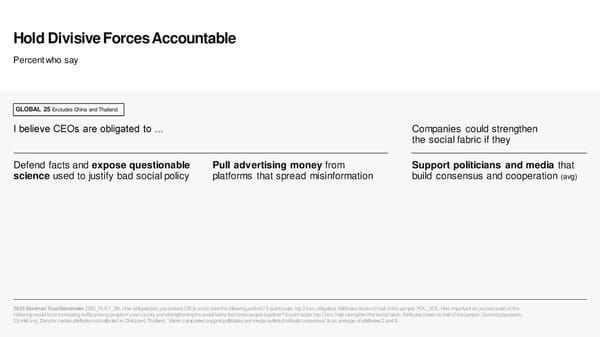
Hold Divisive Forces Accountable Percent who say GLOBAL 25 Excludes China and Thailand I believe CEOs are obligated to … Companies could strengthen the social fabric if they Defend facts and expose questionable Pull advertising money from Support politicians and media that science used to justify bad social policy platforms that spread misinformation build consensus and cooperation (avg) 2023 Edelman Trust Barometer. CEO_PLAY_BK. How obligated do you believe CEOs are to take the following actions? 5-point scale; top 3 box, obligated. Attributes shown to half of the sample. POL_SOL. How important do you feel each of the following would be to increasing civility among people in your country and strengthening the social fabric that binds people together? 6-point scale; top 3 box, help strengthen the social fabric. Attributes shown to half of the sample. General population, 25-mkt avg. Data for certain attributes not collected in China and Thailand. “When companies support politicians and media outlets that build consensus” is an average of attributes 2 and 9.
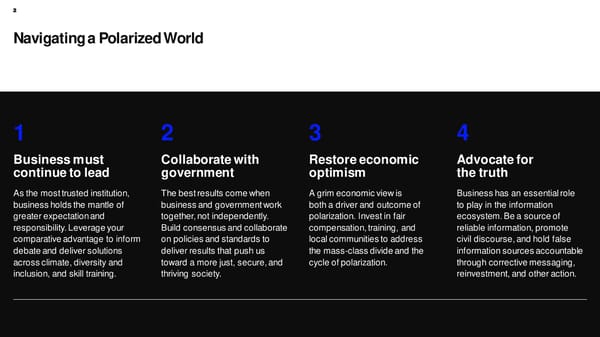
Navigating a Polarized World 1 2 3 4 Business must Collaborate with Restore economic Advocate for continue to lead government optimism the truth As the most trusted institution, The best results come when A grim economic view is Business has an essential role business holds the mantle of business and government work both a driver and outcome of to play in the information greater expectation and together, not independently. polarization. Invest in fair ecosystem. Be a source of responsibility. Leverage your Build consensus and collaborate compensation, training, and reliable information, promote comparative advantage to inform on policies and standards to local communities to address civil discourse, and hold false debate and deliver solutions deliver results that push us the mass-class divide and the information sources accountable across climate, diversity and toward a more just, secure, and cycle of polarization. through corrective messaging, inclusion, and skill training. thriving society. reinvestment, and other action.

2022 2023 Trust Index: Trust Stable General population General population 57 Global 26 55 Global 26 Amid Economic Headwinds 83 China 83 China - 0 + 76 UAE 75 Indonesia Change, 2022 to 2023 75 Indonesia 74 UAE 74 India 73 India Biggest gainers: 72 Saudi Arabia 71 Saudi Arabia Trust Index 66 Malaysia 66 Singapore U.S. +5 (the average percent trust in NGOs, business, 66 Singapore 66 Thailand government and media) 66 Thailand 63 Kenya Colombia +3 Significant change 60 Kenya 62 Malaysia Kenya +3 Distrust Neutral Trust 59 Mexico 61 Mexico (1-49) (50-59) (60-100) 57 The Netherlands 56 Nigeria 56 Nigeria 54 The Netherlands Biggest losers: 54 Canada 53 Brazil 53 Australia 52 Canada 53 Italy 51 Colombia S. Korea -6 51 Brazil 50 Italy Australia -5 51 Ireland 48 Australia 48 Colombia 48 Ireland Malaysia -4 48 S. Africa 48 U.S. 46 Germany 47 S. Africa 45 Argentina 46 Germany 2023 Edelman Trust Barometer. The Trust Index is the average percent trust in NGOs, 45 Spain 44 Spain business, government and media. TRU_INS. Below is a list of institutions. For each one, 44 UK please indicate how much you trust that institution to do what is right. 9-point scale; top 4 43 UK box, trust. General population, 26-mkt avg. *Sweden is not included in the global average. 43 U.S. 42 Argentina Due to a translation inconsistency, the France data was removed from this slide. For more 42 S. Korea 38 Japan details contact the Trust Barometer research team. 40 Japan 36 S. Korea
Trust in Business Declines in 15, Gains in 8 of 27 Countries Percent trust - 0 + Significant change Distrust Neutral Trust (1-49) (50-59) (60-100) Greatest trust 84 83 80 increase in the U.S. 78 73 71 71 71 68 68 66 64 62 62 61 57 55 54 54 53 52 52 52 50 50 49 47 GLOBAL 27 38 0 pts 62 Change, 0 +2 +1 0 -1 +1 0 +1 +5 -3 -2 0 -2 -1 -2 -2 +6 -4 n/a -1 -4 -2 -2 +2 +1 -2 -1 -5 2022 to 2023 2023 Edelman Trust Barometer. TRU_INS. [BUSINESS] Below is a list of institutions. For each one, please indicate how much you trust that institution to do what is right. 9-point scale; top 4 box, trust. General population, 27-mkt avg. *Sweden is not included in the global average. Year-over-year changes were tested for significance using a t-test set at the 99%+ confidence level.
Trust in NGOs Declines in 17, Gains in 6 of 27 Countries Percent trust - 0 + Significant change Distrust Neutral Trust (1-49) (50-59) (60-100) 78 76 74 71 70 69 69 68 68 66 65 61 60 57 56 55 53 53 53 51 50 49 47 47 46 GLOBAL 27 -1 44 41 59 pt 38 Change, +1 +3 -4 +2 -3 -1 -1 0 +1 -1 -3 -2 0 -2 -4 0 -5 -2 0 -4 +5 -5 -2 -1 -2 n/a +1 -3 2022 to 2023 2023 Edelman Trust Barometer. TRU_INS. [NGOs] Below is a list of institutions. For each one, please indicate how much you trust that institution to do what is right. 9-point scale; top 4 box, trust. General population, 27-mkt avg. *Sweden is not included in the global average. Year-over-year changes were tested for significance using a t-test set at the 99%+ confidence level.
Trust in Government Declines in 14, Gains in 10 of 26 Countries Percent trust - 0 + Significant change Distrust Neutral Trust (1-49) (50-59) (60-100) 89 86 83 76 76 76 57 56 54 GLOBAL 26 51 51 47 47 47 46 -1 45 43 42 40 40 pt 37 36 35 34 33 50 22 20 Change, -2 -1 +1 +2 0 +2 n/a -4 -8 -2 -7 0 -2 +4 -3 -7 +4 +3 +6 +8 -5 +2 +1 -8 -3 -4 -2 2022 to 2023 2023 Edelman Trust Barometer. TRU_INS. [GOVERNMENT] Below is a list of institutions. For each one, please indicate how much you trust that institution to do what is right. 9-point scale; top 4 box, trust. General population, 26-mkt avg. *Sweden is not included in the global average. Year-over-year changes were tested for significance using a t-test set at the 99%+ confidence level. Due to a translation error, the France data was removed from this slide. For more details contact the Trust Barometer research team.
Trust in Media Declines in 16, Gains in 6 of 27 Countries Percent trust - 0 + Significant change Distrust Neutral Trust (1-49) (50-59) (60-100) 79 72 67 63 62 62 60 59 56 55 55 51 50 47 47 46 GLOBAL 27 -1 43 41 41 40 39 38 38 38 38 pt 37 34 50 27 Change, -1 -1 +1 +6 -4 -2 -4 0 +2 -5 -3 0 -2 0 -3 -1 +4 0 n/a -5 +1 -5 -5 0 -2 +2 -1 -6 2022 to 2023 2023 Edelman Trust Barometer. TRU_INS. [MEDIA] Below is a list of institutions. For each one, please indicate how much you trust that institution to do what is right. 9-point scale; top 4 box, trust. General population, 27-mkt avg. *Sweden is not included in the global average. Year-over-year changes were tested for significance using a t-test set at the 99%+ confidence level. Note: in S. Korea, the term used for Media means “News media”.
My Employer Trusted Around the World Percent trust - 0 + Significant change Distrust Neutral Trust (1-49) (50-59) (60-100) GLOBAL 26 excludes France 92 91 90 86 86 85 82 80 80 79 78 76 76 76 76 76 75 75 75 74 73 73 72 71 71 68 63 78 54 MY EMPLOYER Business 62 Change, 2022 to 2023 +1 +1 +1 +1 +3 +4 -3 +1 -5 -3 -1 +5 +3 0 0 +2 +1 -1 n/a -1 -2 -1 -4 +4 +2 -4 +3 +1 NGOs 59 Government 50 Media 50 2023 Edelman Trust Barometer.TRU_INS. Below is a list of institutions. For each one, please indicate how much you trust that institution to do what is right.9-point scale; top 4 box, trust. General population, 26-mkt avg.“Your employer” only shown to those who are an employee of an organization (Q43/1). *Sweden is not included in the global average. Year-over-year changes were tested for significance using a t-test set at the 99%+ confidence level. Due to a translation inconsistency, the France data was removed from the global data. For more details contact the Trust Barometer research team.
Trust in Industry Sectors Remains Stable Percent trust GLOBAL 27 - 0 + Significant change Distrust Neutral Trust (1-49) (50-59) (60-100) 75 71 71 70 69 67 67 66 65 65 65 63 63 61 59 59 44 Change, +1 +1 +2 0 n/a 0 -2 +1 n/a +1 -2 +1 -3 -2 0 +1 -1 2022 to 2023 2023 Edelman Trust Barometer. TRU_IND. Please indicate how much you trust businesses in each of the following industries to do what is right. 9-point scale; top 4 box, trust. Industries shown to half of the sample. General population, 27-mkt avg. Year-over-year changes were tested for significance using a t-test set at the 99%+ confidence level.
Family-Owned Businesses Most Trusted Percent who trust each type of business to do what is right GLOBAL 27 - 0 + Significant change Distrust Neutral Trust (1-49) (50-59) (60-100) 67 58 55 50 Change, -1 -2 -2 -2 2022 to 2023 Family-owned Privately-held Publicly-traded State-owned 2023 Edelman Trust Barometer. TRU_ORG. Thinking about different types of businesses, please indicate how much you trust each type of business to do what is right. 9-point scale; top 4 box, trust. Question asked of half of the sample. General population, 27-mkt avg. Year-over-year changes were tested for significance using a t-test set at the 99%+ confidence level.
WHO Most Trusted Multinational Organization Percent trust GLOBAL 27 - 0 + Significant change Distrust Neutral Trust (1-49) (50-59) (60-100) 67 59 56 Change, 2022 to 2023 0 -3 0 The World The United Nations The European Union Health Organization 2023 Edelman Trust Barometer. TRU_INS. Below is a list of institutions. For each one, please indicate how much you trust that institution to do what is right. 9-point scale; top 4 box, trust. Attributes asked of half of the sample. General population, 27- mkt avg. Year-over-year changes were tested for significance using a t-test set at the 99%+ confidence level.
Trust in the European Union Increases in 11 of 27 Countries Percent trust - 0 + Significant change Distrust Neutral Trust (1-49) (50-59) (60-100) 73 72 71 70 69 67 66 63 60 60 60 58 57 56 56 55 54 53 51 50 47 45 45 44 44 GLOBAL 27 40 38 35 0 pts 56 Change, +2 -2 +5 -5 -3 -2 +1 -4 -1 -3 +4 +3 -3 -3 n/a +4 -4 +7 -6 -1 +3 0 +6 -9 +7 +1 -1 -3 2022 to 2023 2023 Edelman Trust Barometer. TRU_INS. [THE EUROPEAN UNION] Below is a list of institutions. For each one, please indicate how much you trust that institution to do what is right. 9-point scale; top 4 box, trust. Attribute asked of half of the sample. General population, 27-mkt avg. *Sweden is not included in the global average. Year-over-year changes were tested for significance using a t-test set at the 99%+ confidence level.
Trust in the World Health Organization Increases in 15 of 27 Countries Percent trust - 0 + Significant change Distrust Neutral Trust (1-49) (50-59) (60-100) 85 85 84 83 82 81 78 73 72 71 70 69 68 68 68 65 63 63 62 62 61 60 59 57 57 55 54 GLOBAL 27 38 0 pts 67 Change, +5 +1 +4 -4 +4 +4 +1 +1 -1 -4 -5 -2 -1 n/a -4 +1 +2 -3 +2 +2 +7 -1 +3 0 +8 +1 -2 0 2022 to 2023 2023 Edelman Trust Barometer. TRU_INS. [THE WHO] Below is a list of institutions. For each one, please indicate how much you trust that institution to do what is right. 9-point scale; top 4 box, trust. Attribute asked of half of the sample. General population, 27-mkt avg. *Sweden is not included in the global average. Year-over-year changes were tested for significance using a t-test set at the 99%+ confidence level.
Trust in the United Nations Decreases in 21 of 27 Countries Percent trust - 0 + Significant change Distrust Neutral Trust (1-49) (50-59) (60-100) 80 79 79 78 78 72 69 67 65 61 58 58 58 58 57 56 54 54 53 53 52 52 50 49 49 47 GLOBAL 27 -3 43 59 pts 35 Change, -5 -1 -1 -2 -2 -3 -5 -4 +1 +2 -4 -5 -10 n/a -2 -6 -7 0 -7 -4 0 +3 -5 -1 +1 -2 -5 -7 2022 to 2023 2023 Edelman Trust Barometer.TRU_INS. [THE UNITED NATIONS] Below is a list of institutions. For each one, please indicate how much you trust that institution to do what is right. 9-point scale; top 4 box, trust. Attribute asked of half of the sample. General population, 27-mkt avg. *Sweden is not included in the global average. Year-over-year changes were tested for significance using a t-test set at the 99%+ confidence level.
Minimal Trust Gains for News Sources Percent trust GLOBAL 27 - 0 + Significant change Distrust Neutral Trust (1-49) (50-59) (60-100) 63 59 47 41 Change, +1 +1 +1 +1 2022 to 2023 Search engines Traditional media Owned media Social media Least-trusting S. Korea 49 U.S. 48 Japan 29 Canada 21 countries for France 47 S. Korea 43 *Sweden 25 France 19 each source Japan 44 Japan 39 S. Korea 22 *Sweden 19 2023 Edelman Trust Barometer. COM_MCL. When looking for general news and information, how much would you trust each type of source for general news and information? 9-point scale; top 4 box, trust. Question asked of half of the sample. General population, 27-mkt avg. Year-over-year changes were tested for significance using a t-test set at the 99%+ confidence level. *Sweden is not included in the global average.

2023 Edelman Trust Barometer: Sample Sample Size, Quotas and Margin of Error Market Weighed Sample Size1 Unweighted Sample Size 2 2 3 Margin of Error – Total Sample Margin of Error – Half Sample Quotas Set On Global 27 31,050 31,171 +/- 0.6 percentage points total sample +/- 0.8 percentage points half sample Quotas set at the market level Argentina 1,150 1,120 Australia 1,150 1,152 +/- 2.9 pct pts. total sample +/- 4.1 pct pts. half sample Brazil 1,150 1,150 Canada 1,150 1,500 +/- 2.5 pct pts. total sample +/- 3.6 pct pts. half sample 4 1,150 China 1,149 Colombia 1,150 1,151 France 1,150 1,151 Germany 1,150 1,150 India 1,150 1,145 Indonesia 1,150 1,118 Ireland 1,150 1,150 +/- 2.9 pct pts. total sample +/- 4.1 pct pts. half sample Italy 1,150 1,151 Japan 1,150 1,150 Kenya 1,150 1,150 Age, Gender, Region Malaysia 1,150 1,120 Mexico 1,150 1,150 Nigeria 1,150 1,142 Saudi Arabia 1,150 1,082 +/- 3.0 pct pts. total sample +/- 4.2 pct pts. half sample Singapore 1,150 1,135 S. Africa 1,150 1,153 S. Korea 1,150 1,150 Spain 1,150 1,150 Sweden 1,150 1,150 +/- 2.9 pct pts. total sample +/- 4.1 pct pts. half sample Thailand 1,150 1,133 The Netherlands 1,150 1,142 UAE 1,150 1,143 UK 1,150 1,150 U.S. 1,150 1,134 1. Data reported on slides is weighted to the same total base size to ensure each market has an equal effect on the global tota. l Some questions were asked of only half of the sample. Please refer to the footnotes on each slide for details. 2. Margin of error is calculated on the unweighted sample sizes collected. 3. There were additional quotas on ethnicity in the UK and U.S., and on nationality in the UAE and Saudi Arabia. 4. All data collected in China is from the mainland. Regions of Greater China were not surveyed.
2023 Edelman Trust Barometer: Sample Countries Included in the Various Global Averages 28 countries Global 27 average Global 26 Global 25 Global 24 Global 24 surveyed Excludes France Excludes China and Thailand Excludes China and Thailand Used for current year averages Used for current year averages; Used for tracking to 2022; excludes Used for tracking to 2020; excludes Used for tracking to 2019 and tracking to 2022 excludes France2 sensitive markets1 sensitive markets1 Argentina Argentina Argentina Argentina Argentina Argentina Australia Australia Australia Australia Australia Australia Brazil Brazil Brazil Brazil Brazil Brazil Canada Canada Canada Canada Canada Canada China China China ----- ----- China Colombia Colombia Colombia Colombia Colombia Colombia France France ----- France France France Germany Germany Germany Germany Germany Germany India India India India India India Indonesia Indonesia Indonesia Indonesia Indonesia Indonesia Ireland Ireland Ireland Ireland Ireland Ireland Italy Italy Italy Italy Italy Italy Japan Japan Japan Japan Japan Japan Kenya Kenya Kenya Kenya Kenya ----- Malaysia Malaysia Malaysia Malaysia Malaysia Malaysia Mexico Mexico Mexico Mexico Mexico Mexico Nigeria Nigeria Nigeria Nigeria ----- ----- Saudi Arabia Saudi Arabia Saudi Arabia Saudi Arabia Saudi Arabia Saudi Arabia Singapore Singapore Singapore Singapore Singapore Singapore S. Africa S. Africa S. Africa S. Africa S. Africa S. Africa S. Korea S. Korea S. Korea S. Korea S. Korea S. Korea Spain Spain Spain Spain Spain Spain Sweden ----- ----- ----- ----- ----- Thailand Thailand Thailand ----- ----- ----- The Netherlands The Netherlands The Netherlands The Netherlands The Netherlands The Netherlands UAE UAE UAE UAE UAE UAE UK UK UK UK UK UK U.S. U.S. U.S. U.S. U.S. U.S. 1. Because some of the content we ask is deemed politically sensitive there are several countries where we take special precautionsin order to avoid putting our respondents, or ourselves, in a position to break any local laws. We work closely with our sample partner and its legal team to identify which questions, and in what countries, we should refrain from asking. The twocountries where we removed questions and/or answer options were China and Thailand. 2. Due to a translation inconsistency, the France data was removed from the global data. For more details contact the Trust Barometer research team.
2023 Edelman Trust Barometer: Sample Survey Languages Used and Internet Penetration by Country Languages Internet Languages Internet Languages Internet Penetration* Penetration* Penetration* Global - 87% Indonesia Indonesian 76% S. Africa Localized English, 63% Afrikaans Argentina Localized Spanish 91% Ireland Localized English 89% S. Korea Korean 97% Australia Localized English 89% Italy Italian 91% Spain Spanish 92% Brazil Portuguese 83% Kenya Localized English 84% Sweden Localized English, 97% Swedish Canada Localized English, 93% Japan Japanese 93% Thailand Thai 88% Canadian French China Simplified Chinese 70% Malaysia Malay 94% The Localized English, Dutch 95% Netherlands Colombia Localized Spanish 83% Mexico Localized Spanish 77% UAE Localized English, Arabic 100% France French 92% Nigeria Localized English 68% UK Localized English 95% Germany German 94% Saudi Arabia Localized English, Arabic 89% U.S. English, 94% Localized Spanish India Localized English, Hindi 60% Singapore Localized English, 92% Simplified Chinese *Data source: http://www.internetworldstats.com/stats.htm as of 1/5/23
Data Analyses Explained: How We Plotted Countries by Country Division Entrenchment Polarization score (y-axis) (x-axis) (sum) Polarization Levels Argentina 87 77 164 Colombia 74 62 136 U.S. 67 66 133 To visualize country-level polarization, we plotted countries based on the percentage of respondents in each Spain 56 77 133 country who see deep divisions and feel those divisions are entrenched. S. Africa 61 71 132 Depth of Division forms the y-axis. A country’s Division score is the percent who believe their country is Sweden 51 79 130 very/extremely divided, using POL_DEG.* Japan 47 75 122 Italy 41 79 120 POL_DEG. Using the scale below, please indicate how divided on key societal issues you believe Brazil 65 55 120 your country is today. 5-point scale; top 2 box = very/extremely divided.* UK 50 69 119 A country’s Entrenchment score is on the x-axis. It’s the percent who do not believe that their country will be able to The Netherlands 43 75 118 work through its divisions, using POL_PROG. This scorewas measured only among respondents who believe their France 51 66 117 country is very/extremely divided (POL_DEG/4-5). Mexico 52 65 117 S. Korea 55 61 116 POL_PROG. How likely or unlikely do you think it is that your country will be able to work Germany 41 75 116 through or overcome its ideological divisions and lack of agreement on key issues and Australia 35 74 109 challenges? 8-point scale; codes 2-5 = unlikely/neutral, among POL_DEG/4-5 = Entrenched Canada 38 71 109 The tableto the right shows each country’s Division and Entrenchment score, as well as the total Polarization Thailand 48 50 98 score. Cut-points were then determined that would allow us to group countries based their level of polarization.The Nigeria 49 49 98 first step in the cut-point determination process was to look for natural gaps in the scores. We then further tested Ireland 32 64 96 these cut-points by profiling countries in each of the 4 resulting groupings to make sure that they displayed Kenya 39 47 86 differences along key polarization-related dimensions. The final cut points used to characterize a country’s level of India 35 36 71 Polarization is shown below. UAE 18 48 66 Severely polarized: sum of 130 or higher Singapore 18 46 64 In danger of severe polarization: sum between 115 to 129 Saudi Arabia 18 43 61 China 14 45 59 Moderately polarized: sum between 80 to 114 Malaysia 28 27 55 Not polarized: sum less than 80 Indonesia 11 44 55 *Division score was calculated using a rebased POL_DEG excluding respondents who selected “don’t know.”
Data Analyses Explained: How We Defined Questions related to polarization Polarization Groups POL_DEG: Using the scale below, please indicate how divided on key societal issues you believe your country is today. 1. Not at all divided To measure perceptions of societal polarization, we asked two questions, shown 2. A little divided at the right. First, we measured the degree of perceived division on key societal issues within each country. Then, among only those who reported their country 3. Somewhat divided is very or extremely divided, we measured respondents’ belief that their country 4. Very divided can work through Based on their responses to these two questions, respondents were assigned to one of the three groups described here: 5. Extremely divided • Not very divided (code 0): respondents who say their country isn’t very 99.Don’t know / Not sure divided (POL_DEG/1-3). POL_PROG: How likely or unlikely do you think it is that your country will be able to work through • Divided, not entrenched (code 1): respondents who see their country as or overcome its ideological divisions and lack of agreement on key issues and challenges? very or extremely divided (POL_DEG/4-5), but believe these divisions can be 1. Ideological divisions and a lack of agreement on key issues are not a problem in this country overcome or are not an issue (POL_PROG/1, 6-8). 2. It will never happen • Polarized: our divisions are entrenched (code 2):respondents who see 3. Very unlikely their country as very or extremely divided (POL_DEG/4-5), AND who also believe these divisions cannot be overcome (POL_PROG/2-5). 4. Unlikely These categories also defined a three-point polarization scale which was used 5. Neither likely nor unlikely as the outcome variable in a linear regression we used to identify the drivers of 6. Likely perceptions of polarization as detailed on the regressionpage. 7. Very likely 8. It will definitely happen 99.Don’t know / Not sure
2023 Edelman Trust Barometer Global Report How We Calculated the Determinants of Polarization Drivers Question text and scoring We also wanted to know what leads to polarization. We found that distrust, identity, TRU_INS. [GOVERNMENT] Below is a list of institutions. For each one, please unfairness, and pessimism were significant drivers. Distrust in indicate how much you trust that institution to do what is right using a 9-point government scale where one means that you “do not trust them at all” and nine means that you “trust them a great deal”.9-point scale; bottom 4 box = distrust in The factors depicted in the report are significant drivers of polarization as determined by a government linear regression. Polarization refers to the 3-pt scale described on the polarization SOC_FAB_STR. How true is each of the following statements regarding the definition slide. The full model, depicted below, accounts for 17.71% of the observed Lack of shared current situation in your country? For each one, please rate how true you believe variance in polarization scores. identity that statement is using a nine-point scale where one means it is “not at all true” Polarization= and nine means it is “completely true”. 9-point scale; (r1,3,6,7), average score between 1-5 = lack of shared identity (0.2351)+(.3380)DistrustInGovernment+(.3068)LackOfSharedIdentity+(.2478)SystemI nequality +(.1465)EconomicPessimism+(.1431)SocietalFears+(.1062)DistrustInMedia POP_MDC. Below is a list of statements. For each one, please rate how true you Systemic believe that statement is using a nine-point scale where one means it is “not at all The coefficient listed next to each factor indicates the increase in the polarization score unfairness true” and nine means it is “completely true”. 9-point scale; (r2,3,18*,19*), average associated with that factor being present, holding all other factors constant. This score of 6 or greater = systemic unfairness *reverse scored standardized value allowed us to rank the importance of each predictor variable and determine what factors drive polarization the most. All coefficients were significant at a Economic CNG_FUT. Thinking about the economic prospects for yourself and your family, p<.001 level. pessimism how do you think you and your family will be doing in five years’ time? Select one response. 5-point scale, codes 4,5 = economic pessimism Drivers Coefficient POP_EMO. Some people say they worry about many things while others say Distrust in government .3380 they have few concerns. We are interested in what you worry about. Specifically, Societal fears how much do you worry about each of the following? Please indicate your answer Lack of shared identity .3068 using a nine-point scale where one means “I do not worry about this at all” and Systemic unfairness .2478 nine means “I am extremely worried about this”. 9-point scale; top 4 box at a majority of items (r14, 27, 43, 30, 31, 32, 33) = societal fears Economic pessimism .1465 TRU_INS. [MEDIA] Below is a list of institutions. For each one, please indicate Societal fears .1431 Distrust in media how much you trust that institution to do what is right using a 9-point scale where Distrust in media .1062 one means that you “do not trust them at all” and nine means that you “trust them Constant .2351 a great deal”. 9-point scale; bottom 4 box = distrust in media
Data Analyses Explained: How We Plotted the Institutional Competence and Ethics Scores We define trust as the combination of competence and ethics. The report features a chart depicting how competent and ethical each of the Respondents were asked: institution are rated to be. Here’s how we calculated each score. In thinking about why you do or do not trust [INSTITUTION], please specify where you The competence score (the x-axis of the plot): An institution’s think they fall on the scale between the two opposing descriptions. (Please use the slider competence score is a net of the top 3 box (AGREE) minus the bottom 3 to indicate where you think [INSTITUTION] falls between the two extreme end points of box (DISAGREE) responses to the question “To what extent do you each scale.) agree with the following statement? [INSTITUTION] in general is good at what it does”. The resulting net score was then subtracted by 50, which means that for an institution to qualify as competent, it would require a Dimension Ethical Perception Unethical Perception net difference of 51 points or more in its percentage of top 3-box ratings versus its bottom 3-box ratings. This ensures that an institution could not Highly effective agents of Completely ineffective agents be considered competent unless there is a majority who rate it as such. Purpose-Driven positive change of positive change The net ethical score (the y-axis of the plot):The ethics dimension is Honest Honest and fair Corrupt and biased defined by four separate items. For each item, a net score was calculated by taking the top 5 box percentage representing a positive ethical perception minus the bottom 5 box percentage representing a Vision Have a vision for the future Do not have a vision for the future that negative ethical perception. The y-axis value is an average across those that I believe in I believe in 4 net scores. Scores higher than zero indicate an institution that is Fairness Serve the interests of everyone Serve the interests of only certain perceived as ethical. equally and fairly groups of people
2023 Edelman Trust Barometer: Analyses How We Calculated Belief-Driven Buyers In the June 2022 Edelman Trust Barometer Special Report: The New Cascade of Influence, respondents were asked a series of questions Respondents were asked: regarding the role their values, opinions about social issues, and Please indicate how much you agree or disagree with the following statements political beliefs played in their purchasing decisions. The Belief- Driven Buyer (BDB) scale was created by averaging respondents’ answers to the seven 9-pt agree/disagree scale items, shown in the 1. Even if a company makes the product that I like most, I will not buy it if I disagree table to the right. with the company’s stand on important social issues • Non-belief-driven buyers were those that scored between 1 – 4.99 on the BDB scale, meaning on average they disagreed with these 2. If a brand offers the best price on a product, I will buy it even if I disagree with the statements. company’s stand on controversial social or political issues • Respondents who scored between 5.00 – 9.00 on the BDB scale I have bought a brand for the first time for the sole reason that I appreciated its were classified as belief-driven buyers, meaning on average they 3. position on a controversial societal or political issue saw themselves reflected at least to some extent in these statements I have stopped buying one brand and started buying another because I liked the 4. politics of one more than the other 5. I have strong opinions about many societal and political issues. The brands I choose to buy and not buy are one important way I express those opinions. 6. I have stopped buying a brand solely because it remained silent on a controversial societal or political issue that I believed it had an obligation to publicly address

2023 Edelman Trust Barometer: Full Text For Answer Choices Abbreviated Personal Economic and Societal Fears POP_EMO. Some people say they worry about many things while others say they have few concerns. We are interested in what you worry about. Specifically, how much do you worry about each of the following? Please indicate your answer using a nine-point scale where one means “I do not worry about this at all” and nine means “I am extremely worried about this”. Shortened Full Automation and/or other innovations taking your job away Your job being moved to other countries where workers are paid less Cheaper foreign competitors driving companies like yours out of business Job loss (net) Not having the training and skills necessary to get a good paying job International conflicts about trade policies and tariffs hurting the company you work for Losing your job as a result of a looming recession Permanent jobs with benefits being replaced by freelance, gig-economy or short-term jobs that do not offer benefits Inflation Your pay increases not keeping up with the inflation rate causing you to lose ground financially Climate change Climate change leading to drought, rising sea levels and other natural disasters Nuclear war International conflicts escalating into nuclear war Food shortages Food shortages leading to hoarding, riots, and hunger Energy shortages An energy shortage that makes it difficult for you to heat your home, power your appliances, or keep your car fueled
2023 Edelman Trust Barometer: Full Text For Answer Choices Abbreviated Polarization Fears NAT_POL_CONS. What do you see as the likely consequences of these divisions within your country if they are not addressed? Shortened Full Worsening prejudice and The worsening of prejudice and discrimination discrimination Slower economic development Our rate of economic development will slow, and we will not be well positioned for future prosperity Violence in the streets Violence in the streets Inability to address societal An inability to adequately address our societal challenges challenges I will suffer financially I will suffer financially
2023 Edelman Trust Barometer: Full Text For Answer Choices Abbreviated Business Engagement on Societal Issues BUS_BND. Think about business as an institution, and its current level of engagement in addressing societal needs and issues. When it comes to each of the following areas, please indicate if you think business is going too far and overstepping what it should be doing, is doing just the right amount in regard to this activity, or is not going far enough in its actions and should be doing more. Shortened Full Climate change Addressing climate change Economic inequality Redressing economic inequality, narrowing the opportunity gaps between the richest and poorest in this country, and lifting people out of poverty Energy shortages Addressing global energy shortages and increasing energy costs Healthcare access Increasing access to good quality healthcare Trustworthy information Controlling the malicious spreading of misleading and false information and ensuring the availability of trustworthy information Workforce reskilling Doing the workforce reskilling and retraining necessary to keep people employable whose jobs are being eliminated or greatly altered by automation and artificial intelligence
2023 Edelman Trust Barometer: Full Text For Answer Choices Abbreviated Expectations for CEOs on Societal Issues CEO_ISS_EXP. For each of the following issues, please indicate what you expect CEOs to do. Shortened Full Treatment of workers Treatment of workers Climate change Climate change Discrimination Discrimination and the treatment of minority groups Wealth gap How to address the gap between the rich and poor Immigration Immigration, refugees, and guest workers
2023 Edelman Trust Barometer: Full Text For Answer Choices Abbreviated Business Can Avoid Being Seen As Politically Motivated ENG_ISS_HOW. You just said that it is possible for a business to engage in addressing contentious societal issues in ways that you would not consider to be political or politically motivated. Which of the following would be ways that a company could do that? Shortened Full Be a trustworthy information source Be a trustworthy information source regarding an issue but don’t take sides Base actions on science Show that their actions are based on generally agreed upon facts or well-established scientific evidence Don’t align with only one political Show how their engagement on societal issues over time does not consistently align with one political party or another party Act on same values over time Tie their actions to a set of values that they have consistently supported over time Link actions to staying competitive Link their actions to the needs of their business and their ability to stay competitive in the marketplace
2023 Edelman Trust Barometer: Full Text For Answer Choices Abbreviated CEO Obligations CEO_PLAY_BK. How obligated do you believe CEOs are to take the following actions? Shortened Full Pay a fair wage Pay a fair wage to all employees and work to ensure that their suppliers are doing the same Ensure their home community is Work to ensure that the community in which their organization is headquartered is safe, strong, and thriving safe and thriving Pay fair corporate taxes Make sure that their organization pays its fair share of local taxes to help fund government programs meant to improve the education system, increase access to good quality healthcare, expand public services, and provide job retraining to displaced workers Retrain employees Retrain workers whose jobs are eliminated due to technology and automation Defend facts and expose questionable science used to justify Defend facts and expose questionable or fraudulent science being used to justify bad law or social policy bad social policy Pull advertising money from Pull the organization’s advertising money out of media platforms and news outlets that do not adequately control the spread of platforms that spread misinformation misinformation
2023 Edelman Trust Barometer: Full Text For Answer Choices Abbreviated Business Strengthening the Social Fabric POL_SOL. How important do you feel each of the following would be to increasing civility among people in your country and strengthening the social fabric that binds people together? Shortened Full Support politicians and media that Companies using their power and influence to get politicians to engage in consensus building and cooperation build consensus and cooperation Companies spending their advertising money on media channels and news programs that emphasize cooperation, moderation, and (avg) consensus building, and not on those which worsen divisions among different groups of people and support extreme positions
Cover Image Credits 1. The Queen Visits Drapers' Hall in London For Luncheon On The 70th Anniversary Of Her Majesty's Admission To The Freedom Of The Company: ChrisJackson -WPA Poolpvia Getty Images 2. Supporters Of Brazilian Former President Jair Bolsonaro Invade PlanaltoPresidential Palace On Jan 8 In Brazil: Sergio Lima/ AFP via Getty Images 3. Ukrainian President Volodymyr Zelensky During A Join Press Conference With UN Secretary-General in Kyiv, Ukraine: Sergei Supinsky/ AFP via Getty Images 4. Pakistan’s Naval Personnel Rescue Flood-affected People From Their Homes: Aamir Qureshi/ AFP via Getty Images 5. Solidarity Demonstration In Memory Of MahsaAminiIn Krakow, Poland: Beata Zawrzel/ NurPhotovia Getty Images 6. Elon Musk Offers To Buy Twitter: Jakub Porzycki/ NurPhotovia Getty Images 7. Sam Bankman-fried, CEO Of FTX US Derivatives, Testifies During The U.S. House Agriculture Committee Hearing: Tom Williams/ CQ-Roll Call, Inc via Getty Images 8. Health Workers Wear Protective Suits As They Disinfect An Area Outside A Barricaded Community in China: Kevin Frayer via Getty Images Divider Image Credits Slide 4 Four Forces That Lead To Polarization Economic Anxieties: Don’t Pay UK protest Over Rising Fuel Bills in London, England: Guy Smallman via Getty Images Institutional Imbalance: U.S. Capital building: Douglas Rissingvia iStock/Getty Images; Low angle of high-rise buildings in Toronto, Canada: Sean Pollock via Unsplash Mass-Class Divide: Activists' Groups, The Poor People's Campaign And Low-Wage Workers' Assembly March On Wall Street: Michael M.Santiago via Getty Images The Battle for Truth: Womanreading news on smartphone and laptop in Thailand: Oatawa via iStock/ Getty Images Slide 5 Facing Economic Fears Without a Trust Safety Net Woman Checking Her Bill At The Supermarket in Serbia: LordHenriVotonvia Getty Images Slide 14 Distrust Breeds Polarization Supporters of Brazilian former President Jair Bolsonaro invade PlanaltoPresidential Palace on Jan 8 in Brazil: Sergio Lima / AFP via Getty Images Slide 25 Great Expectations, Heightened Risk for Business Activists of Trinamool Congress in Kolkata, India display banners and slogans against government policies Dibyangshusarkar/ AFP via Getty Images Slide 31 Navigating a Polarized World Volunteers picking up plastics at lakeshore in Germany: Maskotvia Getty Images
2023 Edelman Trust Barometer Team EDELMAN TRUST INSTITUTE ADVISORS Executive Director, Tonia E. Ries Richard Edelman Thought Leadership tonia.ries@edelman.com Executive Advisors Kirsty Graham Dave Samson David M. Bersoff, Ph.D. DXI Research Advisor Antoine Harary Thought Leadership Research david.bersoff@edelmandxi.com Theresa Peterson, M.A. Cody Armstrong MARKETING Research Abbey Derse Analysis and Operations Rosie Delk Vanessa Pymble Claire Ritzmann Mike Bush Catherine Aumiller Polly Mingledorff Marketing Ryann Gastwirth Data and Analytics John Zamites Kayley Goff Kiera Cooke Pamela Blandon Heather Daniels-Gontier Drake Baer Romain Maradan Narrative and Esther Choi Content Strategy Chloe Buckley John Plecha Brooke Walker Design Megan Gilbert Han Xu Justin Blake Edelman Trust Institute Leadership, Ellie Smith Partnerships and Content Teams Caitlin Semo Susannah Ferris