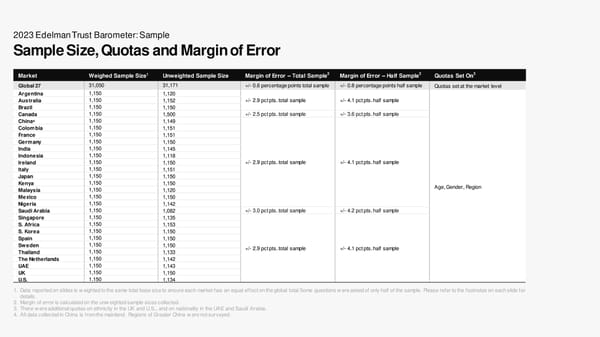
2023 Edelman Trust Barometer: Sample Sample Size, Quotas and Margin of Error Market Weighed Sample Size1 Unweighted Sample Size 2 2 3 Margin of Error – Total Sample Margin of Error – Half Sample Quotas Set On Global 27 31,050 31,171 +/- 0.6 percentage points total sample +/- 0.8 percentage points half sample Quotas set at the market level Argentina 1,150 1,120 Australia 1,150 1,152 +/- 2.9 pct pts. total sample +/- 4.1 pct pts. half sample Brazil 1,150 1,150 Canada 1,150 1,500 +/- 2.5 pct pts. total sample +/- 3.6 pct pts. half sample 4 1,150 China 1,149 Colombia 1,150 1,151 France 1,150 1,151 Germany 1,150 1,150 India 1,150 1,145 Indonesia 1,150 1,118 Ireland 1,150 1,150 +/- 2.9 pct pts. total sample +/- 4.1 pct pts. half sample Italy 1,150 1,151 Japan 1,150 1,150 Kenya 1,150 1,150 Age, Gender, Region Malaysia 1,150 1,120 Mexico 1,150 1,150 Nigeria 1,150 1,142 Saudi Arabia 1,150 1,082 +/- 3.0 pct pts. total sample +/- 4.2 pct pts. half sample Singapore 1,150 1,135 S. Africa 1,150 1,153 S. Korea 1,150 1,150 Spain 1,150 1,150 Sweden 1,150 1,150 +/- 2.9 pct pts. total sample +/- 4.1 pct pts. half sample Thailand 1,150 1,133 The Netherlands 1,150 1,142 UAE 1,150 1,143 UK 1,150 1,150 U.S. 1,150 1,134 1. Data reported on slides is weighted to the same total base size to ensure each market has an equal effect on the global tota. l Some questions were asked of only half of the sample. Please refer to the footnotes on each slide for details. 2. Margin of error is calculated on the unweighted sample sizes collected. 3. There were additional quotas on ethnicity in the UK and U.S., and on nationality in the UAE and Saudi Arabia. 4. All data collected in China is from the mainland. Regions of Greater China were not surveyed.
 2023 Edelman Trust Barometer Page 55 Page 57