2022 Trust Barometer
Edelman | 2022 | 69 pages

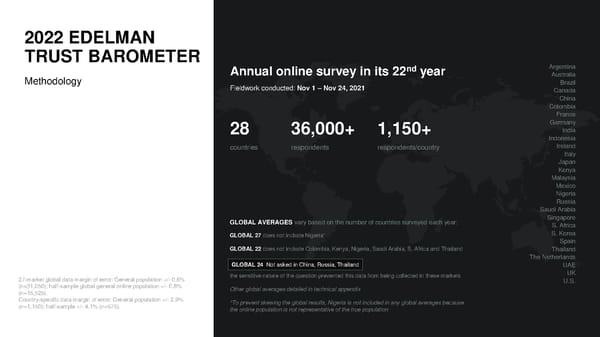
2022 EDELMAN TRUST BAROMETER Annual online survey in its 22nd year Argentina Methodology Australia Fieldwork conducted: Nov 1 – Nov 24, 2021 Brazil Canada China Colombia France Germany 28 36,000+ 1,150+ India Indonesia countries respondents respondents/country Ireland Italy Japan Kenya Malaysia Mexico Nigeria Russia Saudi Arabia GLOBAL AVERAGES vary based on the number of countries surveyed each year: Singapore S. Africa GLOBAL 27 does not include Nigeria* S. Korea Spain GLOBAL 22 does not includeColombia, Kenya, Nigeria, Saudi Arabia, S. Africa and Thailand Thailand The Netherlands GLOBAL 24 Not asked in China, Russia, Thailand UAE the sensitive nature of the question prevented this data from being collected in these markets UK 27-market global data margin of error: General population +/- 0.6% U.S. (n=31,050); half-sample global general online population +/- 0.8% Other global averages detailed in technical appendix (n=15,525). Country-specific data margin of error: General population +/- 2.9% *To prevent skewing the global results, Nigeria is not included in any global averages because (n=1,150); half-sample +/- 4.1% (n=575). the online population is not representative of the true population
22 YEARS OF TRUST ‘01 ‘02 ‘03 ‘04 ‘05 ‘06 ‘07 ‘08 ‘09 ‘10 ‘11 Rising Fall of the Earned Media U.S. Trust A “Person Like Business Young People Trust in Performance Business Must Influence of Celebrity CEO More Credible Companies in Shifts from Me” Emerges More Trusted Have More Business and Partner With NGOs Than Europe Suffer “Authorities” as Credible Than Trust in Plummets Transparency Government to Advertising Trust Discount to Peers Spokesperson Government Business Essential to Regain Trust and Media Trust ‘12 ‘13 ‘14 ‘15 ‘16 ‘17 ‘18 ‘19 ‘20 ‘21 ‘22 Fall of Crisis of Business Trust is Growing Trust in The Battle Trust Trust: Business The Cycle Government Leadership to Lead Essential to Inequality Crisis for Truth at Work Competence Most Trusted of Distrust the Debate Innovation of Trust and Ethics for Change
GOVERNMENT AND MEDIA FUEL A CYCLE OF DISTRUST

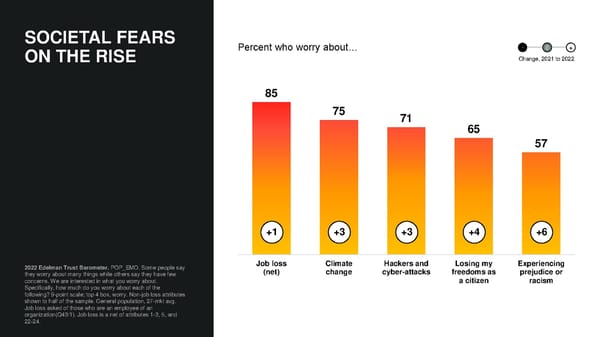
SOCIETAL FEARS - 0 + Percent who worry about… ON THE RISE Change, 2021 to 2022 85 75 71 65 57 +1 +3 +3 +4 +6 2022 Edelman Trust Barometer. POP_EMO. Some people say Job loss Climate Hackers and Losing my Experiencing they worry about many things while others say they have few (net) change cyber-attacks freedoms as prejudice or concerns. We are interested in what you worry about. a citizen racism Specifically, how much do you worry about each of the following? 9-point scale; top 4 box, worry. Non-job loss attributes shown to half of the sample. General population, 27-mkt avg. Job loss asked of those who are an employee of an organization(Q43/1). Job loss is a net of attributes 1-3, 5, and 22-24.
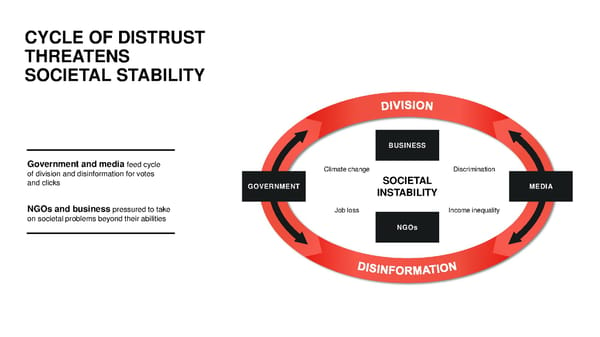
CYCLE OF DISTRUST THREATENS SOCIETAL STABILITY BUSINESS Government and media feed cycle Climate change Discrimination of division and disinformation for votes SOCIETAL and clicks GOVERNMENT MEDIA INSTABILITY NGOs and business pressured to take Job loss Income inequality on societal problems beyond their abilities NGOs
FAILURE OF LEADERSHIP MAKES DISTRUST THE DEFAULT
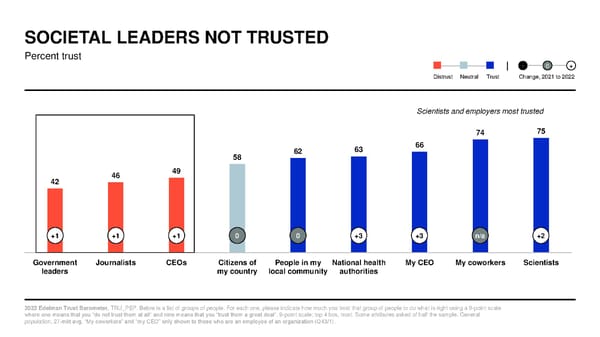
SOCIETAL LEADERS NOT TRUSTED Percent trust - 0 + Distrust Neutral Trust Change, 2021 to 2022 Scientists and employers most trusted 74 75 62 63 66 58 46 49 42 +1 +1 +1 0 0 +3 +3 n/a +2 Government Journalists CEOs Citizens of People in my National health My CEO My coworkers Scientists leaders my country local community authorities 2022 Edelman Trust Barometer. TRU_PEP. Below is a list of groups of people. For each one, please indicate how much you trust that group of people to do what is right using a 9-point scale where one means that you “do not trust them at all” and nine means that you “trust them a great deal”. 9-point scale; top 4 box, trust. Some attributes asked of half the sample. General population, 27-mkt avg. “My coworkers” and “my CEO” only shown to those who are an employee of an organization (Q43/1).
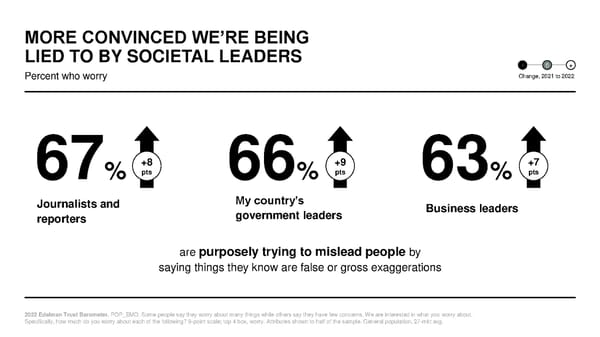
MORE CONVINCED WE’RE BEING LIED TO BY SOCIETAL LEADERS - 0 + Percent who worry Change, 2021 to 2022 +8 +9 +7 67%pts 66% pts 63% pts Journalists and My country’s Business leaders reporters government leaders are purposely trying to mislead people by saying things they know are false or gross exaggerations 2022 Edelman Trust Barometer. POP_EMO. Some people say they worry about many things while others say they have few concerns. We are interested in what you worry about. Specifically, how much do you worry about each of the following? 9-point scale; top 4 box, worry. Attributes shown to half of the sample. General population, 27-mkt avg.
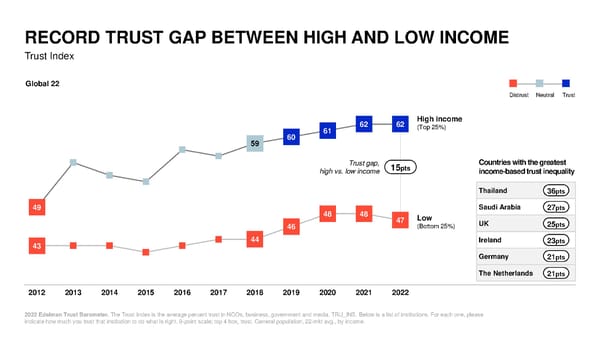
RECORD TRUST GAP BETWEEN HIGH AND LOW INCOME Trust Index Global 22 Distrust Neutral Trust 62 62 High income 61 (Top 25%) 59 60 Trust gap, 15pts Countries with the greatest high vs. low income income-based trust inequality Thailand 36pts 49 48 48 Saudi Arabia 27pts 47 Low UK 25pts 46 (Bottom 25%) 43 44 Ireland 23pts Germany 21pts The Netherlands 21pts 2012 2013 2014 2015 2016 2017 2018 2019 2020 2021 2022 2022 Edelman Trust Barometer. The Trust Index is the average percent trust in NGOs, business, government and media. TRU_INS. Below is a list of institutions. For each one, please indicate how much you trust that institution to do what is right. 9-point scale; top 4 box, trust. General population, 22-mkt avg., by income.
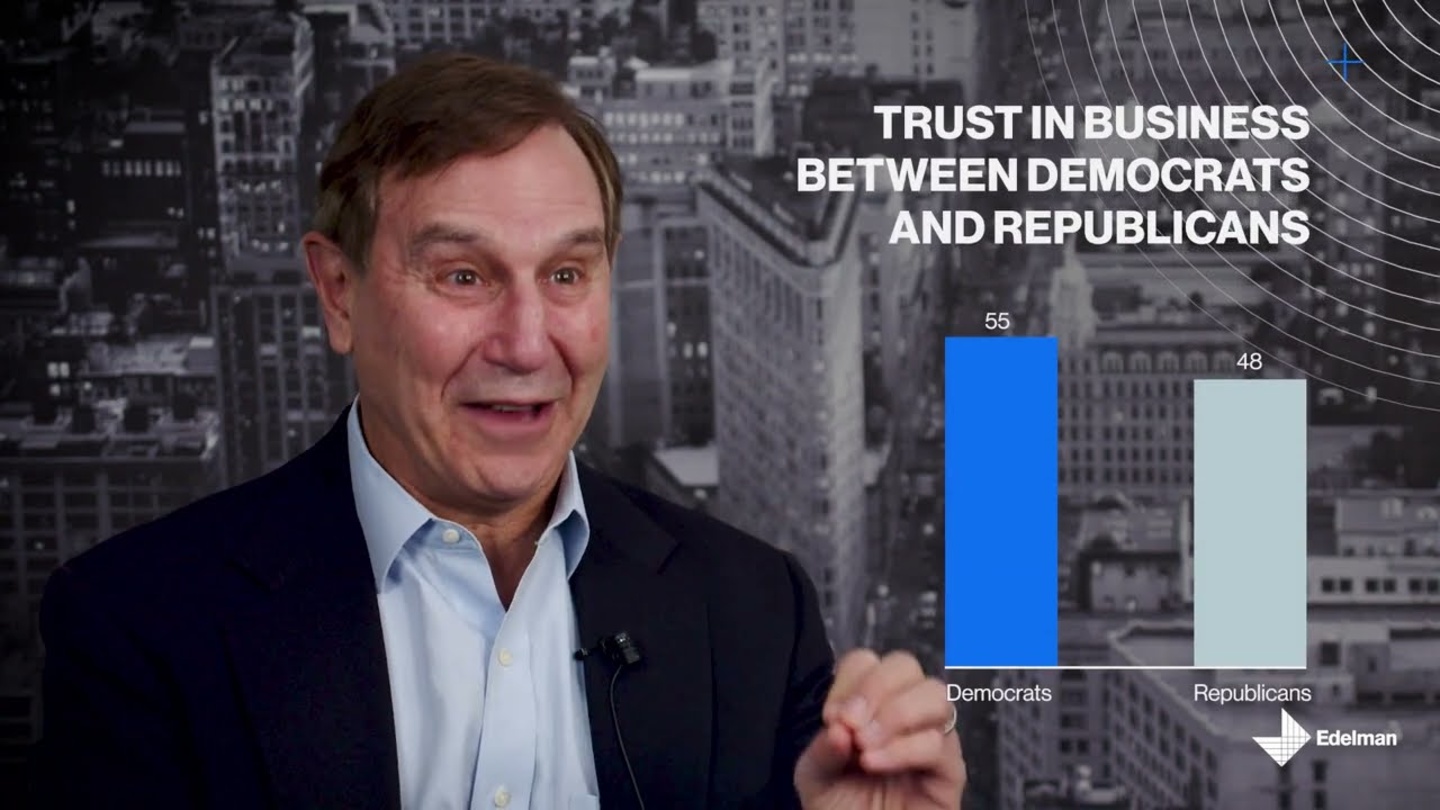
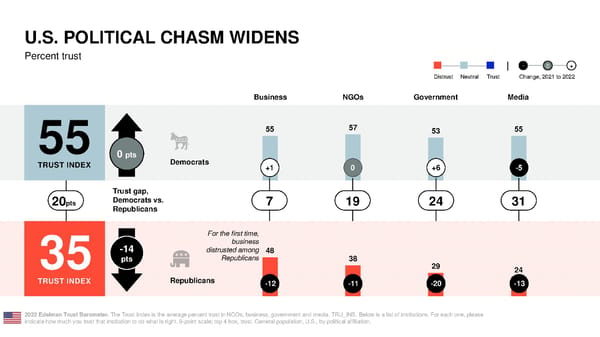
U.S. POLITICAL CHASM WIDENS Percent trust - 0 + Distrust Neutral Trust Change, 2021 to 2022 Business NGOs Government Media 55 55 57 53 55 0 pts Democrats TRUST INDEX +1 0 +6 -5 Trust gap, 20ptss Democrats vs. 7 19 24 31 Republicans For the first time, -14 business distrusted among Republicans 48 35 pts 38 29 24 TRUST INDEX Republicans -12 -11 -20 -13 l 2022 Edelman Trust Barometer. The Trust Index is the average percent trust in NGOs, business, government and media. TRU_INS. Below is a list of institutions. For each one, please indicate how much you trust that institution to do what is right. 9-point scale; top 4 box, trust. General population, U.S., by political affiliation.
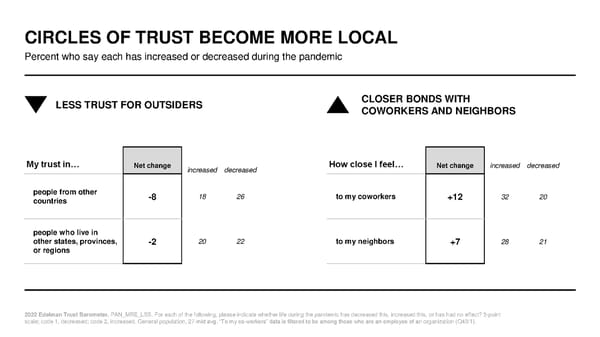
CIRCLES OF TRUST BECOME MORE LOCAL Percent who say each has increased or decreased during the pandemic LESS TRUST FOR OUTSIDERS CLOSER BONDS WITH COWORKERS AND NEIGHBORS My trust in… Net change increased decreased How close I feel… Net change increased decreased people from other -8 18 26 to my coworkers +12 32 20 countries people who live in other states, provinces, -2 20 22 to my neighbors +7 28 21 or regions 2022 Edelman Trust Barometer. PAN_MRE_LSS. For each of the following, please indicate whether life during the pandemic has decreased this, increased this, or has had no effect? 3-point scale; code 1, decreased; code 2, increased. General population, 27-mkt avg. “To my co-workers” data is filtered to be among those who are an employee of an organization (Q43/1).
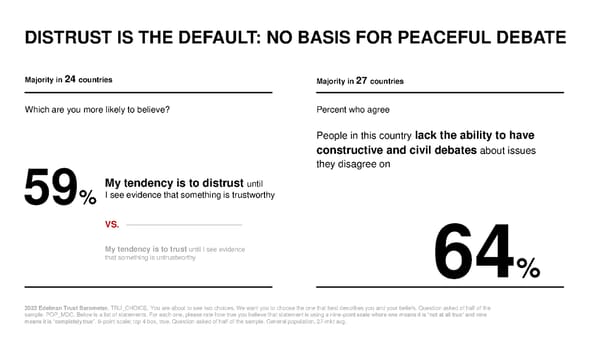
DISTRUST IS THE DEFAULT: NO BASIS FOR PEACEFUL DEBATE Majority in 24 countries Majority in 27 countries Which are you more likely to believe? Percent who agree People in this country lack the ability to have constructive and civil debates about issues they disagree on My tendency is to distrust until 59%I see evidence that something is trustworthy VS. My tendency is to trust until I see evidence that something is untrustworthy 64% 2022 Edelman Trust Barometer. TRU_CHOICE. You are about to see two choices. We want you to choose the one that best describes you and your beliefs. Question asked of half of the sample. POP_MDC. Below is a list of statements. For each one, please rate how true you believe that statement is using a nine-point scale where one means it is “not at all true” and nine means it is “completely true”. 9-point scale; top 4 box, true. Question asked of half of the sample. General population, 27-mkt avg.
COLLAPSE OF TRUST IN DEMOCRACIES
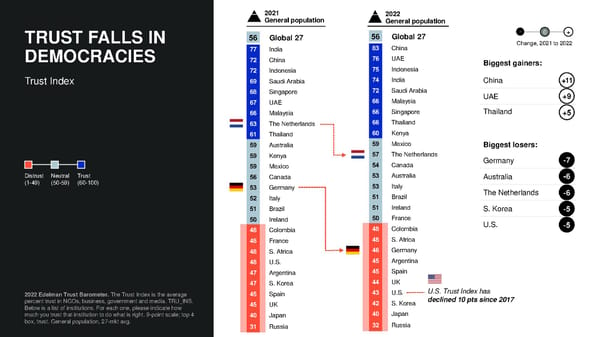
2021 2022 General population General population TRUST FALLS IN 56 Global 27 56 Global 27 - 0 + 77 India 83 China Change, 2021 to 2022 DEMOCRACIES 72 China 76 UAE Biggest gainers: 72 Indonesia 75 Indonesia Trust Index 69 Saudi Arabia 74 India China +11 68 Singapore 72 Saudi Arabia UAE +9 67 UAE 66 Malaysia 66 Malaysia 66 Singapore Thailand +5 63 The Netherlands 66 Thailand 61 Thailand 60 Kenya 59 Australia 59 Mexico Biggest losers: 59 Kenya 57 The Netherlands Germany -7 59 Mexico 54 Canada Distrust Neutral Trust 56 Canada 53 Australia Australia -6 (1-49) (50-59) (60-100) 53 Germany 53 Italy 52 Italy 51 Brazil The Netherlands -6 51 Brazil 51 Ireland S. Korea -5 50 Ireland 50 France U.S. -5 48 Colombia 48 Colombia 48 France 48 S. Africa 48 S. Africa 46 Germany 48 U.S. 45 Argentina 47 Argentina 45 Spain 47 S. Korea 44 UK 2022 Edelman Trust Barometer. The Trust Index is the average 45 Spain 43 U.S. U.S. Trust Index has percent trust in NGOs, business, government and media. TRU_INS. 45 UK 42 S. Korea declined 10 pts since 2017 Below is a list of institutions. For each one, please indicate how 40 Japan much you trust that institution to do what is right. 9-point scale; top 4 40 Japan box, trust. General population, 27-mkt avg. 31 Russia 32 Russia
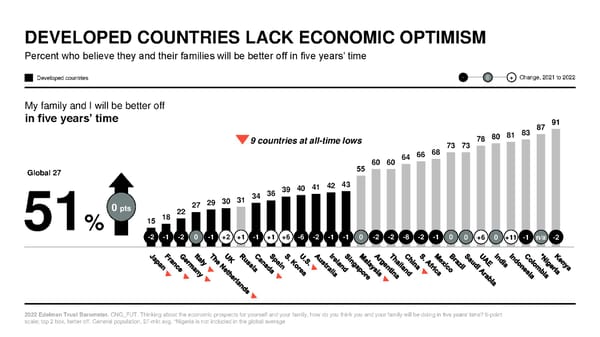
DEVELOPED COUNTRIES LACK ECONOMIC OPTIMISM Percent who believe they and their families will be better off in five years’ time Developed countries - 0 + Change, 2021 to 2022 My family and I will be better off in five years’ time 87 91 9 countries at all-time lows 78 80 81 83 68 73 73 64 66 55 60 60 Global 27 39 40 41 42 43 31 34 36 0 pts 27 29 30 18 22 51% 15 -2 -1 -2 0 -1 +2 +1 -1 +1 +6 -6 -2 -1 -1 0 -2 -2 -8 -2 -1 0 0 +6 0 +11 -1 n/a -2 2022 Edelman Trust Barometer. CNG_FUT. Thinking about the economic prospects for yourself and your family, how do you think you and your family will be doing in five years’ time? 5-point scale; top 2 box, better off. General population, 27-mkt avg. *Nigeria is not included in the global average
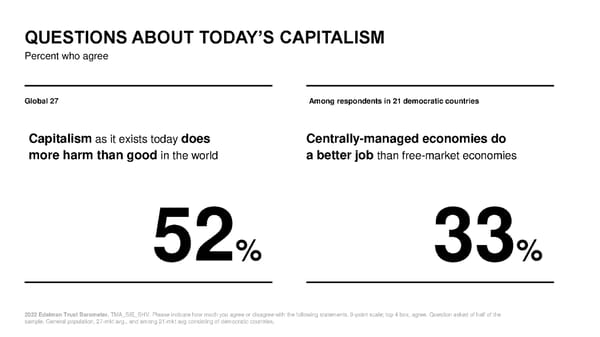
QUESTIONS ABOUT TODAY’S CAPITALISM Percent who agree Global 27 Among respondents in 21 democratic countries Capitalismas it exists today does Centrally-managed economies do more harm than good in the world a better job than free-market economies 52% 33% 2022 Edelman Trust Barometer. TMA_SIE_SHV. Please indicate how much you agree or disagree with the following statements. 9-point scale; top 4 box, agree. Question asked of half of the sample. General population, 27-mkt avg., and among 21-mkt avg consisting of democratic countries.
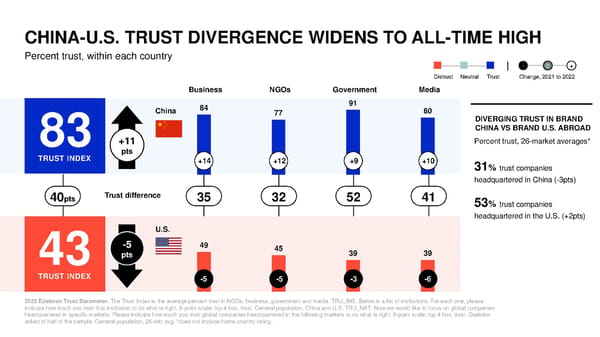
CHINA-U.S. TRUST DIVERGENCE WIDENS TO ALL-TIME HIGH Percent trust, within each country - 0 + Distrust Neutral Trust Change, 2021 to 2022 Business NGOs Government Media 91 China 84 77 80 DIVERGING TRUST IN BRAND CHINA VS BRAND U.S. ABROAD 83 +11 Percent trust, 26-market averages* TRUST INDEX pts +14 +12 +9 +10 31%trust companies headquartered in China (-3pts) 40pts Trust difference 35 32 52 41 53%trust companies headquartered in the U.S. (+2pts) U.S. -5 49 45 43 pts 39 39 TRUST INDEX -5 -5 -3 -6 2022 Edelman Trust Barometer. The Trust Index is the average percent trust in NGOs, business, government and media. TRU_INS. Below is a list of institutions. For each one, please indicate how much you trust that institution to do what is right. 9-point scale; top 4 box, trust. General population, China and U.S. TRU_NAT. Now we would like to focus on global companies headquartered in specific markets. Please indicate how much you trust global companies headquartered in the following markets to do what is right. 9-point scale; top 4 box, trust. Question asked of half of the sample. General population, 26-mkt avg. *does not include home country rating.
SOCIETAL LEADERSHIP NOW A CORE BUSINESS FUNCTION
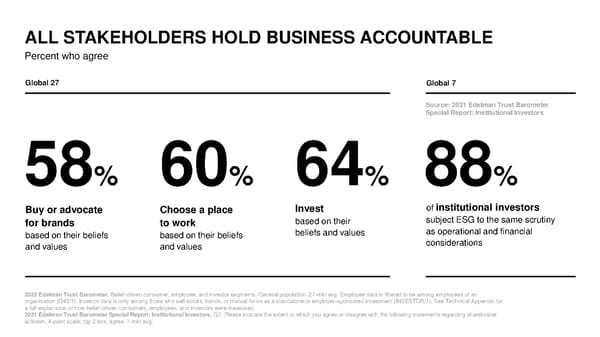
ALL STAKEHOLDERS HOLD BUSINESS ACCOUNTABLE Percent who agree Global 27 Global 7 Source: 2021 Edelman Trust Barometer Special Report: Institutional Investors 58% 60% 64% 88% Buy or advocate Choose a place Invest of institutional investors for brands to work based on their subject ESG to the same scrutiny based on their beliefs based on their beliefs beliefs and values as operational and financial and values and values considerations 2022 Edelman Trust Barometer. Belief-driven consumer, employee, and investor segments. General population, 27-mkt avg. Employee data is filtered to be among employees of an organization (Q43/1). Investor data is only among those who sell stocks, bonds, or mutual funds as a standalone or employer-sponsored investment (INVESTOR/1). See Technical Appendix for a full explanation of how belief-driven consumers, employees, and investors were measured. 2021 Edelman Trust Barometer Special Report: Institutional Investors. Q7. Please indicate the extent to which you agree or disagree with the following statements regarding shareholder activism. 4-point scale; top 2 box, agree. 7-mkt avg.
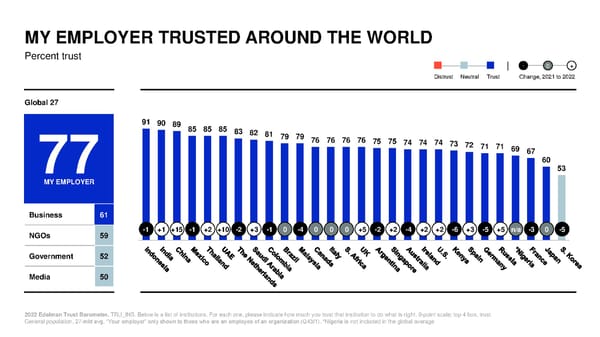
MY EMPLOYER TRUSTED AROUND THE WORLD Percent trust - 0 + Distrust Neutral Trust Change, 2021 to 2022 Global 27 91 90 89 85 85 85 83 82 81 79 79 76 76 76 76 75 75 74 74 74 73 72 71 71 69 67 76% 60 77 53 MY EMPLOYER My employer more trusted than institutions Business 61 NGOs 59 -1 +1 +15 -1 +2 +10 -2 +3 -1 0 -4 0 0 0 +5 -2 +2 -4 +2 +2 -6 +3 -5 +5 n/a -3 0 -5 Government 52 Media 50 2022 Edelman Trust Barometer. TRU_INS. Below is a list of institutions. For each one, please indicate how much you trust that institution to do what is right. 9-point scale; top 4 box, trust. General population, 27-mkt avg. “Your employer” only shown to those who are an employee of an organization (Q43/1). *Nigeria is not included in the global average
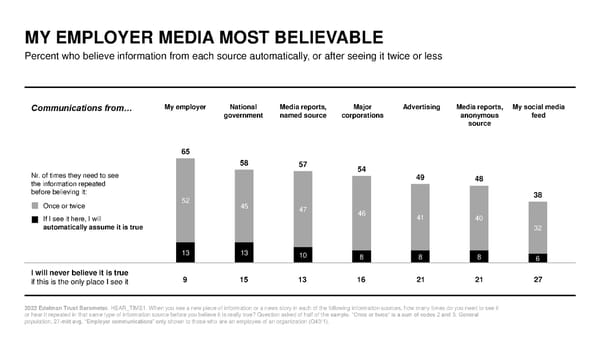
MY EMPLOYER MEDIA MOST BELIEVABLE Percent who believe information from each source automatically, or after seeing it twice or less My employer National Media reports, Major Advertising Media reports, My social media Communications from… government named source corporations anonymous feed source 65 58 57 54 Nr. of times they need to see 49 48 the information repeated before believing it: 38 Once or twice 52 45 47 46 If I see it here, I will 41 40 automatically assume it is true 32 13 13 10 8 8 8 6 I will never believe it is true 9 15 13 16 21 21 27 if this is the only place I see it 2022 Edelman Trust Barometer. HEAR_TIME1. When you see a new piece of information or a news story in each of the following information sources, how many times do you need to see it or hear it repeated in that same type of information source before you believe it is really true? Question asked of half of the sample. “Once or twice” is a sum of codes 2 and 3. General population, 27-mkt avg. “Employer communications” only shown to those who are an employee of an organization (Q43/1).
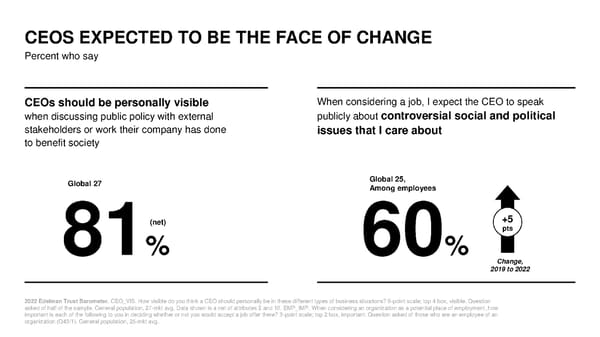
CEOS EXPECTED TO BE THE FACE OF CHANGE Percent who say CEOs should be personally visible When considering a job, I expect the CEO to speak when discussing public policy with external publicly about controversial social and political stakeholders or work their company has done issues that I care about to benefit society Global 27 Global 25, Among employees (net) +5 81% 60% pts Change, 2019 to 2022 2022 Edelman Trust Barometer. CEO_VIS. How visible do you think a CEO should personally be in these different types of business situations? 9-point scale; top 4 box, visible. Question asked of half of the sample. General population, 27-mkt avg. Data shown is a net of attributes 2 and 10. EMP_IMP. When considering an organization as a potential place of employment, how important is each of the following to you in deciding whether or not you would accept a job offer there? 3-point scale; top 2 box, important. Question asked of those who are an employee of an organization (Q43/1). General population, 25-mkt avg.
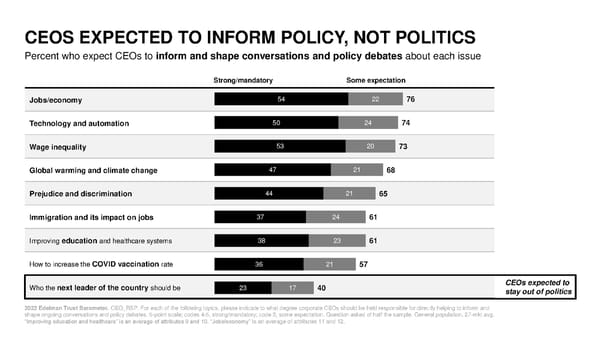
CEOS EXPECTED TO INFORM POLICY, NOT POLITICS Percent who expect CEOs to inform and shape conversations and policy debates about each issue Strong/mandatory Some expectation Jobs/economy 54 22 76 Technology and automation 50 24 74 Wage inequality 53 20 73 Global warming and climate change 47 21 68 Prejudice and discrimination 44 21 65 Immigration and its impact on jobs 37 24 61 Improving education and healthcare systems 38 23 61 COVID vaccination 36 21 How to increase the rate 57 next leader of the country CEOs expected to Who the should be 23 17 40 stay out of politics 2022 Edelman Trust Barometer. CEO_RSP. For each of the following topics, please indicate to what degree corporate CEOs should be held responsible for directly helping to inform and shape ongoing conversations and policy debates. 5-point scale; codes 4-5, strong/mandatory; code 3, some expectation. Question asked of half the sample. General population, 27-mkt avg. “Improving education and healthcare” is an average of attributes 9 and 10. “Jobs/economy” is an average of attributes 11 and 12.
BREAKING THE CYCLE OF DISTRUST
GLOBAL 24 Not asked in China, Russia, Thailand NGOS AND BUSINESS 35 MUST ACT AS STABILIZING FORCES ETHICAL (Competence score, net ethical score) NGOs(3, 24) 2022 2021 Business (12, 14) Business seen as 53 points more competent than government - 50 Media (-18, -2) LESS COMPETENT COMPETENT Government (-41, -12) UNETHICAL 2022 Edelman Trust Barometer. The ethical scores are averages of nets based on [INS]_PER_DIM/1-4. Question asked of half of the sample. The competence score is a net based on TRU_3D_[INS]/1. Depending on the question it was either asked of the full of half the sample. General population, 24-mkt avg. Data not collected in China, Russia and Thailand. For full details regarding how this data was calculated and plotted, please see the Technical Appendix.
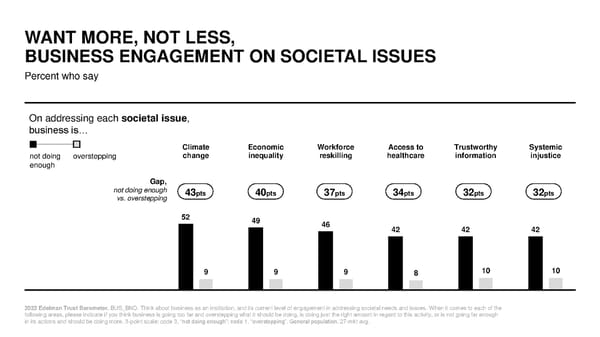
WANT MORE, NOT LESS, BUSINESS ENGAGEMENT ON SOCIETAL ISSUES Percent who say On addressing each societal issue, business is… Climate Economic Workforce Access to Trustworthy Systemic not doing overstepping change inequality reskilling healthcare information injustice enough Gap, not doing enough 43pts 40pts 37pts 34pts 32pts 32pts vs. overstepping 52 49 46 42 42 42 9 9 9 8 10 10 2022 Edelman Trust Barometer. BUS_BND. Think about business as an institution, and its current level of engagement in addressing societal needs and issues. When it comes to each of the following areas, please indicate if you think business is going too far and overstepping what it should be doing, is doing just the right amount in regard to this activity, or is not going far enough in its actions and should be doing more. 3-point scale; code 3, “not doing enough”; code 1, “overstepping”. General population, 27-mkt avg.
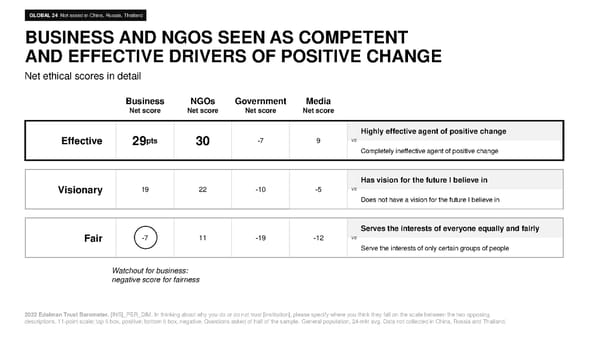
GLOBAL 24 Not asked in China, Russia, Thailand BUSINESS AND NGOSSEEN AS COMPETENT AND EFFECTIVE DRIVERS OF POSITIVE CHANGE Net ethical scores in detail Business NGOs Government Media Net score Net score Net score Net score Highly effective agent of positive change Effective pts -7 9 vs 29 30 Completely ineffective agent of positive change Has vision for the future I believe in Visionary 19 22 -10 -5 vs Does not have a vision for the future I believe in Serves the interests of everyone equally and fairly Fair -7 11 -19 -12 vs Serve the interests of only certain groups of people Watchout for business: negative score for fairness 2022 Edelman Trust Barometer. [INS]_PER_DIM. In thinking about why you do or do not trust [institution], please specify where you think they fall on the scale between the two opposing descriptions. 11-point scale; top 5 box, positive; bottom 5 box, negative. Questions asked of half of the sample. General population, 24-mkt avg. Data not collected in China, Russia and Thailand.
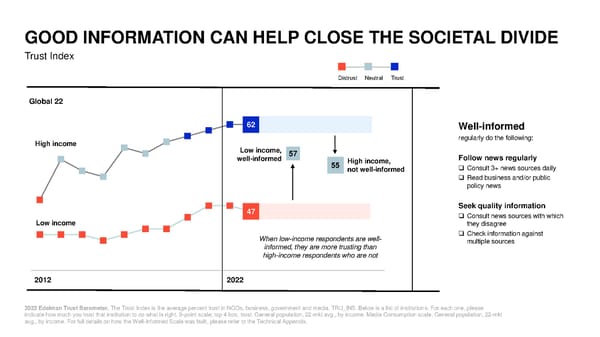
GOOD INFORMATION CAN HELP CLOSE THE SOCIETAL DIVIDE Trust Index Distrust Neutral Trust Global 22 62 Well-informed High income regularly do the following: Low income, 57 Follow news regularly well-informed 55 High income, not well-informed ❑Consult 3+ news sources daily ❑Read business and/or public policy news 47 Seek quality information ❑Consult news sources with which Low income they disagree When low-income respondents are well- ❑Check information against informed, they are more trusting than multiple sources high-income respondents who are not 2012 2022 2022 Edelman Trust Barometer. The Trust Index is the average percent trust in NGOs, business, government and media. TRU_INS. Below is a list of institutions. For each one, please indicate how much you trust that institution to do what is right. 9-point scale; top 4 box, trust. General population, 22-mkt avg., by income. Media Consumption scale. General population, 22-mkt avg., by income. For full details on how the Well-Informed Scale was built, please refer to the Technical Appendix.
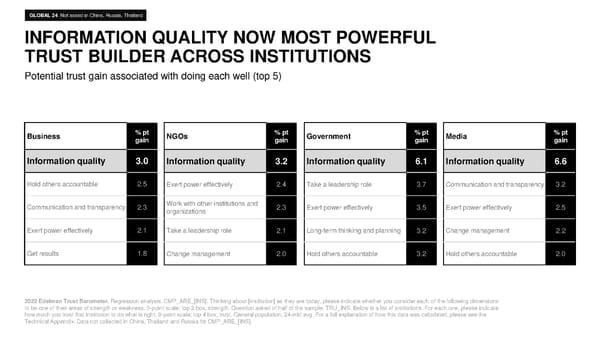
GLOBAL 24 Not asked in China, Russia, Thailand INFORMATION QUALITY NOW MOST POWERFUL TRUST BUILDER ACROSS INSTITUTIONS Potential trust gain associated with doing each well (top 5) Business % pt NGOs % pt Government % pt Media % pt gain gain gain gain Information quality 3.0 Information quality 3.2 Information quality 6.1 Information quality 6.6 Hold others accountable 2.5 Exert power effectively 2.4 Take a leadership role 3.7 Communication and transparency 3.2 Communication and transparency 2.3 Work with other institutions and 2.3 Exert power effectively 3.5 Exert power effectively 2.5 organizations Exert power effectively 2.1 Take a leadership role 2.1 Long-term thinking and planning 3.2 Change management 2.2 Get results 1.8 Change management 2.0 Hold others accountable 3.2 Hold others accountable 2.0 2022 Edelman Trust Barometer. Regression analysis. CMP_ARE_[INS]. Thinking about [institution] as they are today, please indicate whether you consider each of the following dimensions to be one of their areas of strength or weakness. 5-point scale; top 2 box, strength. Question asked of half of the sample. TRU_INS. Below is a list of institutions. For each one, please indicate how much you trust that institution to do what is right. 9-point scale; top 4 box, trust. General population, 24-mkt avg. For a full explanation of how this data was calculated, please see the Technical Appendix. Data not collected in China, Thailand and Russia for CMP_ARE_[INS].
RESTORING TRUST IS KEY TO SOCIETAL STABILITY Business societal role is here to stay People want more business leadership, not less. BUSINESS Demonstrate tangible progress Restore belief in society’s ability to build a better future: show the system works. Sustainability Equity and inclusion Leadership must focus on SOCIETAL long-term thinking GOVERNMENT STABILITY MEDIA Solutions over divisiveness; long-term thinking over short-term gain. Jobs and retraining Wage fairness Every institution must provide trustworthy information Clear, consistent, fact-based information is critical to NGOs breaking the cycle of distrust.
SUPPLEMENTARY DATA
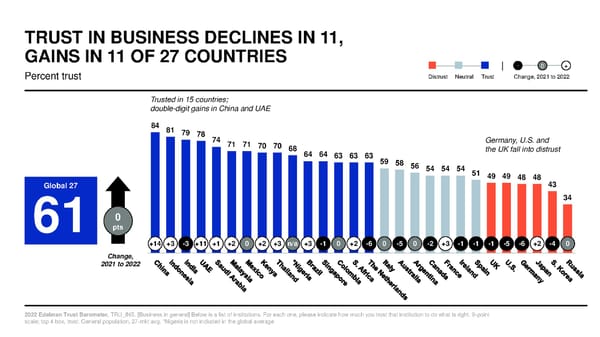
TRUST IN BUSINESS DECLINES IN 11, GAINS IN 11 OF 27 COUNTRIES - 0 + Percent trust Distrust Neutral Trust Change, 2021 to 2022 Trusted in 15 countries; double-digit gains in China and UAE 84 81 79 78 74 Germany, U.S. and 71 71 70 70 68 the UK fall into distrust 64 64 63 63 63 59 58 56 54 54 54 51 49 49 48 48 Global 27 43 34 0 61 pts +14 +3 -3 +11 +1 +2 0 +2 +3 n/a +3 -1 0 +2 -6 0 -5 0 -2 +3 -1 -1 -1 -5 -6 +2 -4 0 Change, 2021 to 2022 2022 Edelman Trust Barometer. TRU_INS. [Businessin general] Below is a list of institutions. For each one, please indicate how much you trust that institution to do what is right. 9-point scale; top 4 box, trust. General population, 27-mkt avg. *Nigeria is not included in the global average
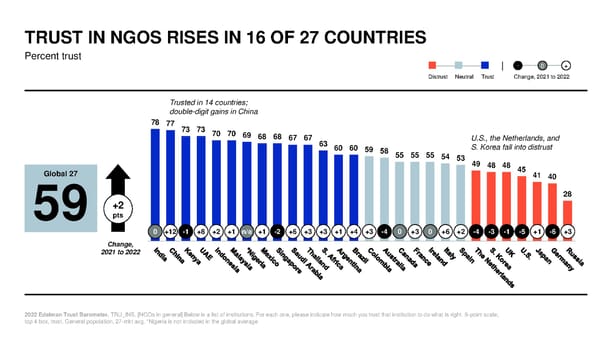
TRUST IN NGOS RISES IN 16 OF 27 COUNTRIES Percent trust - 0 + Distrust Neutral Trust Change, 2021 to 2022 Trusted in 14 countries; double-digit gains in China 78 77 73 73 70 70 69 68 68 67 67 U.S., the Netherlands, and 63 60 60 59 58 S. Korea fall into distrust 55 55 55 54 53 49 48 48 45 Global 27 41 40 28 +2 59 pts 0 +12 -1 +8 +2 +1 n/a +1 -2 +6 +3 +3 +1 +4 +3 -4 0 +3 0 +6 +2 -4 -3 -1 -5 +1 -6 +3 Change, 2021 to 2022 2022 Edelman Trust Barometer. TRU_INS. [NGOs in general] Below is a list of institutions. For each one, please indicate how much you trust that institution to do what is right. 9-point scale; top 4 box, trust. General population, 27-mkt avg. *Nigeria is not included in the global average
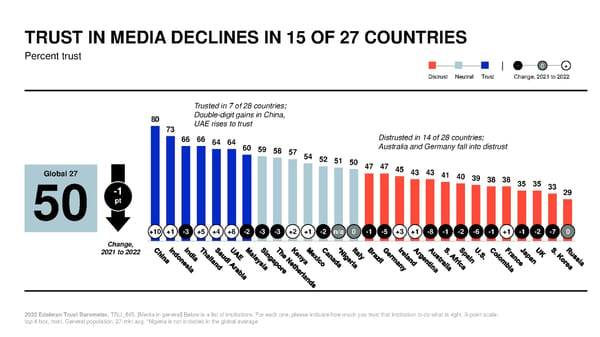
TRUST IN MEDIA DECLINES IN 15 OF 27 COUNTRIES Percent trust - 0 + Distrust Neutral Trust Change, 2021 to 2022 Trusted in 7 of 28 countries; 80 Double-digit gains in China, 73 UAE rises to trust 66 66 64 64 Distrusted in 14 of 28 countries; 60 59 58 57 Australia and Germany fall into distrust 54 52 51 50 Global 27 47 47 45 43 43 41 40 39 38 38 -1 35 35 33 29 50 pt +10 +1 -3 +5 +4 +8 -2 -3 -3 +2 +1 -2 n/a 0 -1 -5 +3 +1 -8 -1 -2 -6 -1 +1 -1 -2 -7 0 Change, 2021 to 2022 2022 Edelman Trust Barometer. TRU_INS. [Media in general] Below is a list of institutions. For each one, please indicate how much you trust that institution to do what is right. 9-point scale; top 4 box, trust. General population, 27-mkt avg. *Nigeria is not included in the global average
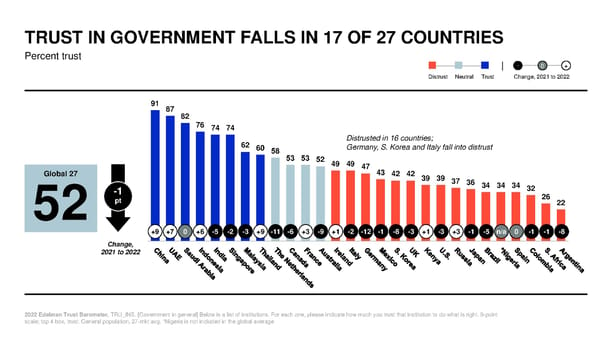
TRUST IN GOVERNMENT FALLS IN 17 OF 27 COUNTRIES Percent trust - 0 + Distrust Neutral Trust Change, 2021 to 2022 91 87 82 76 74 74 62 Distrusted in 16 countries; 60 58 Germany, S. Korea and Italy fall into distrust 53 53 52 49 49 Global 27 47 43 42 42 39 39 37 36 34 34 34 -1 32 52 pt 26 22 +9 +7 0 +6 -5 -2 -3 +9 -11 -6 +3 -9 +1 -2 -12 -1 -8 -3 +1 -3 +3 -1 -5 n/a 0 -1 -1 -8 Change, 2021 to 2022 2022 Edelman Trust Barometer. TRU_INS. [Government in general] Below is a list of institutions. For each one, please indicate how much you trust that institution to do what is right. 9-point scale; top 4 box, trust. General population, 27-mkt avg. *Nigeria is not included in the global average
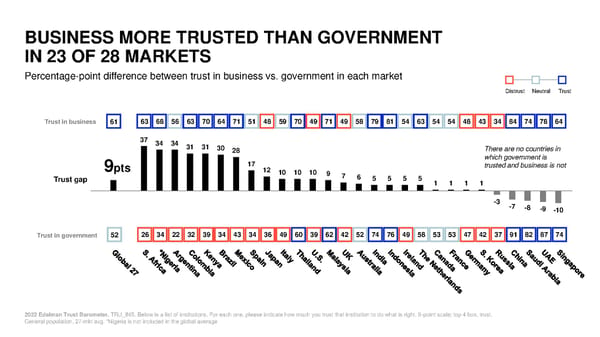
BUSINESS MORE TRUSTED THAN GOVERNMENT IN 23 OF 28 MARKETS Percentage-point difference between trust in business vs. government in each market Distrust Neutral Trust Trust in business 63 68 56 63 70 64 71 51 48 59 70 49 71 49 58 79 81 54 63 54 54 48 43 34 84 74 78 64 61 c cccccccccccccccccccccccccccc 37 34 34 31 31 30 28 There are no countries in 17 which government is 9pts 12 trusted and business is not Trust gap 10 10 10 9 7 6 5 5 5 5 1 1 1 1 -3 -7 -8 -9 -10 Trust in government 52 26 34 22 32 39 34 43 34 36 49 60 39 62 42 52 74 76 49 58 53 53 47 42 37 91 82 87 74 c cccccccccccccccccccccccccccc 2022 Edelman Trust Barometer. TRU_INS. Below is a list of institutions. For each one, please indicate how much you trust that institution to do what is right. 9-point scale; top 4 box, trust. General population, 27-mkt avg. *Nigeria is not included in the global average
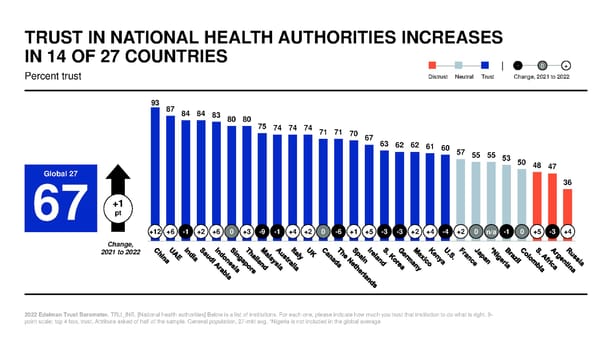
TRUST IN NATIONAL HEALTH AUTHORITIES INCREASES IN 14 OF 27 COUNTRIES - 0 + Percent trust Distrust Neutral Trust Change, 2021 to 2022 93 87 84 84 83 80 80 75 74 74 74 71 71 70 67 63 62 62 61 60 57 55 55 53 50 48 47 Global 27 36 +1 67 pt +12 +6 -1 +2 +6 0 +3 -9 -1 +4 +2 0 -6 +1 +5 -3 -3 +2 +4 -4 +2 0 n/a -1 0 +5 -3 +4 Change, 2021 to 2022 2022 Edelman Trust Barometer. TRU_INS. [National health authorities] Below is a list of institutions. For each one, please indicate how much you trust that institution to do what is right. 9- point scale; top 4 box, trust. Attribute asked of half of the sample. General population, 27-mkt avg. *Nigeria is not included in the global average
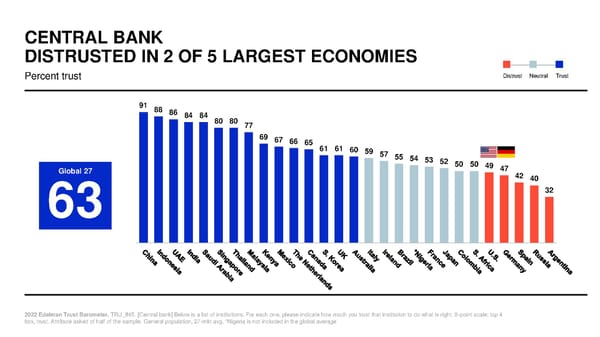
CENTRAL BANK DISTRUSTED IN 2 OF 5 LARGEST ECONOMIES Percent trust Distrust Neutral Trust 91 88 86 84 84 80 80 77 69 67 66 65 61 61 60 59 57 55 54 53 52 50 50 Global 27 49 47 42 40 63 32 2022 Edelman Trust Barometer. TRU_INS. [Central bank] Below is a list of institutions. For each one, please indicate how much you trust that institution to do what is right. 9-point scale; top 4 box, trust. Attribute asked of half of the sample. General population, 27-mkt avg. *Nigeria is not included in the global average
TRUST IN MULTINATIONAL INSTITUTIONS
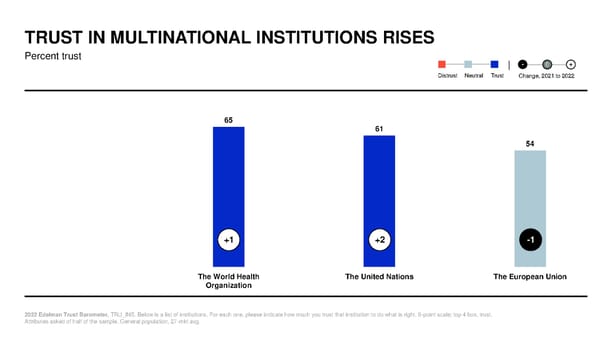
TRUST IN MULTINATIONAL INSTITUTIONS RISES Percent trust - 0 + Distrust Neutral Trust Change, 2021 to 2022 65 61 54 +1 +2 -1 The World Health The United Nations The European Union Organization 2022 Edelman Trust Barometer. TRU_INS. Below is a list of institutions. For each one, please indicate how much you trust that institution to do what is right. 9-point scale; top 4 box, trust. Attributes asked of half of the sample. General population, 27-mkt avg.
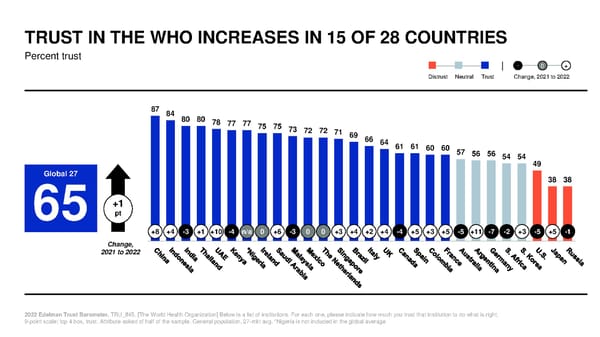
TRUST IN THE WHO INCREASES IN 15 OF 28 COUNTRIES Percent trust - 0 + Distrust Neutral Trust Change, 2021 to 2022 87 84 80 80 78 77 77 75 75 73 72 72 71 69 66 64 61 61 60 60 57 56 56 54 54 49 Global 27 38 38 +1 65 pt +8 +4 -3 +1 +10 -4 n/a 0 +6 -3 0 0 +3 +4 +2 +4 -4 +5 +3 +5 -5 +11 -7 -2 +3 -5 +5 -1 Change, 2021 to 2022 2022 Edelman Trust Barometer. TRU_INS. [The World Health Organization] Below is a list of institutions. For each one, please indicate how much you trust that institution to do what is right. 9-point scale; top 4 box, trust. Attribute asked of half of the sample. General population, 27-mkt avg. *Nigeria is not included in the global average
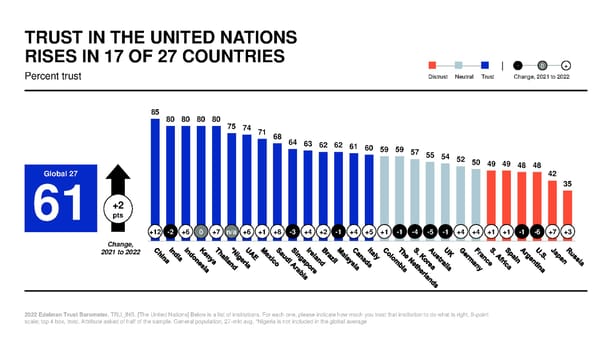
TRUST IN THE UNITED NATIONS RISES IN 17 OF 27 COUNTRIES - 0 + Percent trust Distrust Neutral Trust Change, 2021 to 2022 85 80 80 80 80 75 74 71 68 64 63 62 62 61 60 59 59 57 55 54 52 50 49 49 48 48 Global 27 42 35 +2 61 pts +12 -2 +6 0 +7 n/a +6 +1 +8 -3 +4 +2 -1 +4 +5 +1 -1 -4 -5 -1 +4 +4 +1 +1 -1 -6 +7 +3 Change, 2021 to 2022 2022 Edelman Trust Barometer. TRU_INS. [The United Nations] Below is a list of institutions. For each one, please indicate how much you trust that institution to do what is right. 9-point scale; top 4 box, trust. Attribute asked of half of the sample. General population, 27-mkt avg. *Nigeria is not included in the global average
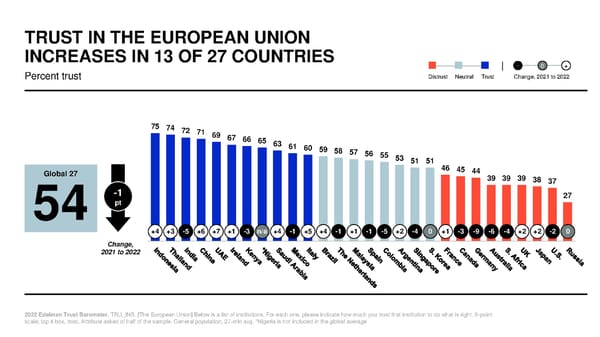
TRUST IN THE EUROPEAN UNION INCREASES IN 13 OF 27 COUNTRIES - 0 + Percent trust Distrust Neutral Trust Change, 2021 to 2022 75 74 72 71 69 67 66 65 63 61 60 59 58 57 56 55 53 51 51 46 Global 27 45 44 39 39 39 38 37 -1 27 54 pt +4 +3 -5 +6 +7 +1 -3 n/a +4 -1 +5 +4 -1 +1 -1 -5 +2 -4 0 +1 -3 -9 -6 -4 +2 +2 -2 0 Change, 2021 to 2022 2022 Edelman Trust Barometer. TRU_INS. [The European Union] Below is a list of institutions. For each one, please indicate how much you trust that institution to do what is right. 9-point scale; top 4 box, trust. Attribute asked of half of the sample. General population, 27-mkt avg. *Nigeria is not included in the global average
TRUST IN VARIOUS TYPES OF BUSINESSES
TRUST IN MOST INDUSTRY SECTORS RISE Percent trust - 0 + Distrust Neutral Trust Change, 2021 to 2022 74 69 69 69 68 Social media 66 66 66 65 64 63 62 61 distrusted and 58 56 falls further 44 +4 +3 +3 +3 +2 +4 +2 +3 +3 +2 +2 +2 +1 0 +3 -2 2022 Edelman Trust Barometer. TRU_IND. Please indicate how much you trust businesses in each of the following industries to do what is right. 9-point scale; top 4 box, trust. Industries shown to half of the sample. General population, 27-mkt avg.
TRUST IN INDUSTRY SECTORS: 10-YEAR TRENDS Percent trust Global 22 Distrust Neutral Trust Change, 2012 2013 2014 2015 2016 2017 2018 2019 2020 2021 2022 2012 - 2022 Technology 77 74 77 74 76 76 75 78 75 68 72 -5 Healthcare - - - - 64 67 65 68 67 66 69 n/a Food and beverage 64 64 65 64 65 68 64 69 67 65 67 +3 Automotive 63 66 70 67 62 66 63 69 67 60 63 0 Telecommunications 59 61 62 60 61 64 64 67 65 61 62 +3 Energy 54 58 57 57 59 62 63 65 63 59 61 +7 Entertainment - 63 66 64 66 65 63 68 65 59 61 n/a Consumer packaged goods 58 61 62 61 62 64 61 65 62 60 60 +2 Financial services 44 47 49 48 52 55 55 57 56 52 54 +10 2022 Edelman Trust Barometer. TRU_IND. Please indicate how much you trust businesses in each of the following industries to do what is right. 9-point scale; top 4 box, trust. Industries shown to half of the sample. General population, 22-mkt avg.
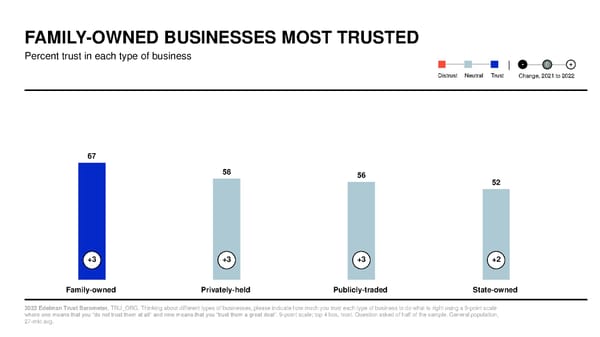
FAMILY-OWNED BUSINESSES MOST TRUSTED Percent trust in each type of business - 0 + Distrust Neutral Trust Change, 2021 to 2022 67 58 56 52 +3 +3 +3 +2 Family-owned Privately-held Publicly-traded State-owned 2022 Edelman Trust Barometer. TRU_ORG. Thinking about different types of businesses, please indicate how much you trust each type of business to do what is right using a 9-point scale where one means that you “do not trust them at all” and nine means that you “trust them a great deal”. 9-point scale; top 4 box, trust. Question asked of half of the sample. General population, 27-mkt avg.
TRUST IN TYPES OF BUSINESSES –9 YEAR TRENDS Percent trust Global 22 Distrust Neutral Trust Change, 2013 2014 2015 2016 2017 2018 2019 2020 2021 2022 2013 - 2022 Family-owned 71 69 65 67 69 - 70 68 63 66 -5 Privately-held - 56 52 55 57 - 59 58 54 56 n/a Publicly-traded - 54 49 52 55 - 58 57 52 54 n/a State-owned - 50 45 49 54 - 57 53 51 52 n/a 2022 Edelman Trust Barometer. TRU_ORG. Thinking about different types of businesses, please indicate how much you trust each type of business to do what is right using a 9-point scale where one means that you “do not trust them at all” and nine means that you “trust them a great deal”. 9-point scale; top 4 box, trust. Question asked of half of the sample. General population, 22-mkt avg.
TRUST IN MOST COUNTRY BRANDS DECLINES Percent trust in companies headquartered in each country - 0 + Distrust Neutral Trust Change, 2021 to 2022 65 65 59 58 57 53 47 36 34 -1 -1 -1 -1 +1 +2 -2 -1 -2 Canada Germany Japan UK France U.S. S. Korea India China 2022 Edelman Trust Barometer. TRU_NAT. Now we would like to focus on global companies headquartered in specific markets. Please indicate how much you trust global companies headquartered in the following markets to do what is right. 9-point scale; top 4 box, trust. Question asked of half of the sample. General population, 27-mkt avg.
TECHNICAL APPENDIX
2022 EDELMAN TRUST BAROMETER: SAMPLES SAMPLE SIZE, QUOTAS AND MARGIN OF ERROR General Population Informed Public Sample Size1 Quotas Set On2 Margin of Error Sample Size5 Quotas Set On3 Margin of Error Global 31,050 Age, Gender, Region +/- 0.6% total sample 6,000 Age, Education, +/- 1.3% total sample +/- 0.8% half sample Gender +/- 1.8% half sample China4 +/- 2.9% total sample Age, Education, +/- 4.4% total sample and U.S. 1,150 Age, Gender, Region +/- 4.1% half sample 500 Gender +/- 6.2% half sample Nigeria 1,150 Age, Gender, Region +/- 2.9% total sample 100 Age, Education, +/- 9.8% total sample +/- 4.1% half sample Gender +/- 13.9% half sample All other 1,150 Age, Gender, Region +/- 2.9% total sample 200 Age, Education, +/- 6.9% total sample countries +/- 4.1% half sample Gender +/- 9.8% half sample NOTE: Because some of the content we ask is deemed politically sensitive there are several countries where we take special precautions in order to avoid putting our respondents, or ourselves, in a position to break any local laws. We work closely with our sample partner and its legal team to identify which questions, and in what countries, we should refrain from asking. The three countries where we removed questions and/or answer options were China, Russia, and Thailand. 1. Some questions were asked of only half of the sample. Please refer to the footnotes on each slide for details. 2. For the general population, there were additional quotas on ethnicity in the UK and U.S., and on nationality in the UAE and Saudi Arabia. 3. For the informed public, there were additional quotas on nationality in the UAE and Saudi Arabia. 4. All data collected in China is from the mainland. Regions of Greater China were not surveyed. 5. In some cases, all the informed public sample was collected within the general population; some countries required an oversample to reach the desired target.
2022 EDELMAN TRUST BAROMETER: SAMPLES COUNTRIES INCLUDED IN THE VARIOUS GLOBAL AVERAGES Global 27 Global 25 Global 24 (S) Global 24 (T) Global 22 Argentina √ √ √ √ √ Australia √ √ √ √ √ Brazil √ √ √ √ √ Canada √ √ √ √ √ China √ √ √ √ Colombia √ √ √ √ France √ √ √ √ √ Germany √ √ √ √ √ India √ √ √ √ √ Indonesia √ √ √ √ √ Ireland √ √ √ √ √ Italy √ √ √ √ √ Japan √ √ √ √ √ Kenya √ √ Malaysia √ √ √ √ √ Mexico √ √ √ √ √ Nigeria Russia √ √ √ √ Saudi Arabia √ √ √ Singapore √ √ √ √ √ S. Africa √ √ √ √ S. Korea √ √ √ √ √ Spain √ √ √ √ √ Thailand √ The Netherlands √ √ √ √ √ UAE √ √ √ √ √ UK √ √ √ √ √ U.S. √ √ √ √ √ Does not include China, Russia, or Full sample, Tracking average back to 2019. Thailand due to the sensitive nature Tracking average back to 2016. Tracking average back to 2012. Does does not include Nigeria Does not include Kenya, Nigeria or of certain questions asked; Nigeria is Does not include Kenya, Nigeria, not include Colombia, Kenya, Nigeria, Thailand not included in this average as well Saudi Arabia or Thailand Saudi Arabia, S. Africa or Thailand since it’s not apart of any averages
2022 EDELMAN TRUST BAROMETER: SAMPLES SURVEY LANGUAGES USED AND INTERNET PENETRATION BY COUNTRY The Edelman Trust Barometer is an online survey. In developed countries, a nationally-representative online sample closely mirrors the general population. In countries with lower levels of internet penetration, a nationally-representative online sample will be more affluent, educated and urban than the general population. Languages Internet Languages Internet Languages Internet Penetration* Penetration* Penetration* Global - 85% Indonesia Indonesian 89% Singapore English, 88% Simplified Chinese Argentina Localized Spanish 91% Ireland English 92% S. Africa English, Afrikaans 58% Australia English 84% Italy Italian 93% S. Korea Korean 96% Brazil Portuguese 75% Kenya English 85% Spain Spanish 93% Canada English, 94% Japan Japanese 95% Thailand Thai 84% French Canadian China Simplified Chinese 69% Malaysia Malay 89% The English, Dutch 96% Netherlands Colombia Localized Spanish 75% Mexico Localized Spanish 67% UAE English, Arabic 100% France French 92% Nigeria Localized English 73% UK English 95% Germany German 96% Russia Russian 81% U.S. English, 90% Localized Spanish India English, Hindi 54% Saudi Arabia English, Arabic 90% *Data source: http://www.internetworldstats.com/stats.htm as of 1/3/22
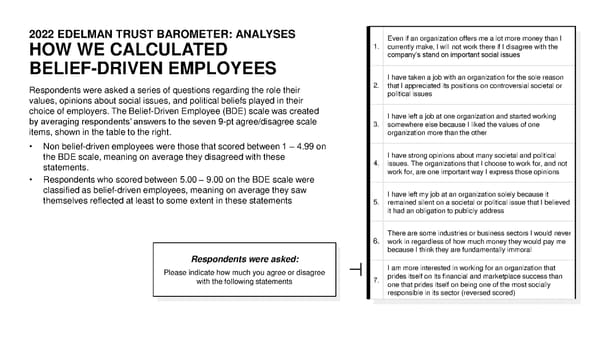
2022 EDELMAN TRUST BAROMETER: ANALYSES Even if an organization offers me a lot more money than I HOW WE CALCULATED 1. currently make, I will not work there if I disagree with the BELIEF-DRIVEN EMPLOYEES company’s stand on important social issues I have taken a job with an organization for the sole reason Respondents were asked a series of questions regarding the role their 2. that I appreciated its positions on controversial societal or values, opinions about social issues, and political beliefs played in their political issues choice of employers. The Belief-Driven Employee (BDE) scale was created I have left a job at one organization and started working by averaging respondents’ answers to the seven 9-pt agree/disagree scale 3. somewhere else because I liked the values of one items, shown in the table to the right. organization more than the other • Non belief-driven employees were those that scored between 1 – 4.99 on the BDE scale, meaning on average they disagreed with these I have strong opinions about many societal and political statements. 4. issues. The organizations that I choose to work for, and not • Respondents who scored between 5.00 – 9.00 on the BDE scale were work for, are one important way I express those opinions classified as belief-driven employees, meaning on average they saw I have left my job at an organization solely because it themselves reflected at least to some extent in these statements 5. remained silent on a societal or political issue that I believed it had an obligation to publicly address There are some industries or business sectors I would never 6. work in regardless of how much money they would pay me because I think they are fundamentally immoral Respondents were asked: Please indicate how much you agree or disagree I am more interested in working for an organization that with the following statements 7. prides itself on its financial and marketplace success than one that prides itself on being one of the most socially responsible in its sector (reversed scored)
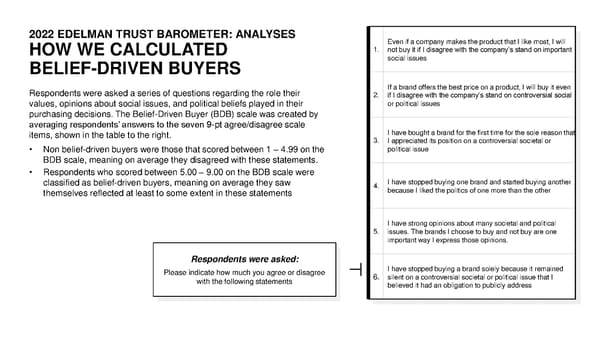
2022 EDELMAN TRUST BAROMETER: ANALYSES Even if a company makes the product that I like most, I will HOW WE CALCULATED 1. not buy it if I disagree with the company’s stand on important BELIEF-DRIVEN BUYERS social issues Respondents were asked a series of questions regarding the role their If a brand offers the best price on a product, I will buy it even 2. if I disagree with the company’s stand on controversial social values, opinions about social issues, and political beliefs played in their or political issues purchasing decisions. The Belief-Driven Buyer (BDB) scale was created by averaging respondents’ answers to the seven 9-pt agree/disagree scale items, shown in the table to the right. I have bought a brand for the first time for the sole reason that 3. I appreciated its position on a controversial societal or • Non belief-driven buyers were those that scored between 1 – 4.99 on the political issue BDB scale, meaning on average they disagreed with these statements. • Respondents who scored between 5.00 – 9.00 on the BDB scale were classified as belief-driven buyers, meaning on average they saw 4. I have stopped buying one brand and started buying another themselves reflected at least to some extent in these statements because I liked the politics of one more than the other I have strong opinions about many societal and political 5. issues. The brands I choose to buy and not buy are one important way I express those opinions. Respondents were asked: Please indicate how much you agree or disagree I have stopped buying a brand solely because it remained with the following statements 6. silent on a controversial societal or political issue that I believed it had an obligation to publicly address
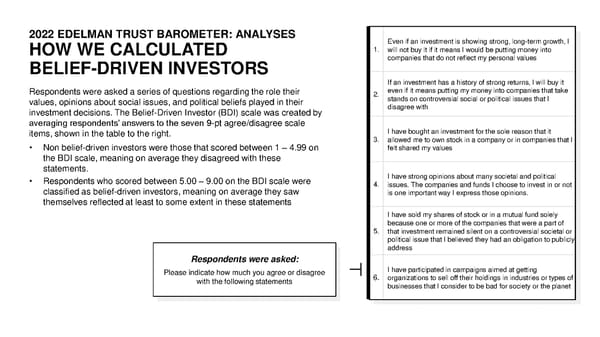
2022 EDELMAN TRUST BAROMETER: ANALYSES Even if an investment is showing strong, long-term growth, I HOW WE CALCULATED 1. will not buy it if it means I would be putting money into BELIEF-DRIVEN INVESTORS companies that do not reflect my personal values If an investment has a history of strong returns, I will buy it Respondents were asked a series of questions regarding the role their 2. even if it means putting my money into companies that take values, opinions about social issues, and political beliefs played in their stands on controversial social or political issues that I investment decisions. The Belief-Driven Investor (BDI) scale was created by disagree with averaging respondents’ answers to the seven 9-pt agree/disagree scale items, shown in the table to the right. I have bought an investment for the sole reason that it 3. allowed me to own stock in a company or in companies that I • Non belief-driven investors were those that scored between 1 – 4.99 on felt shared my values the BDI scale, meaning on average they disagreed with these statements. • Respondents who scored between 5.00 – 9.00 on the BDI scale were I have strong opinions about many societal and political classified as belief-driven investors, meaning on average they saw 4. issues. The companies and funds I choose to invest in or not is one important way I express those opinions. themselves reflected at least to some extent in these statements I have sold my shares of stock or in a mutual fund solely because one or more of the companies that were a part of 5. that investment remained silent on a controversial societal or political issue that I believed they had an obligation to publicly address Respondents were asked: Please indicate how much you agree or disagree I have participated in campaigns aimed at getting with the following statements 6. organizations to sell off their holdings in industries or types of businesses that I consider to be bad for society or the planet
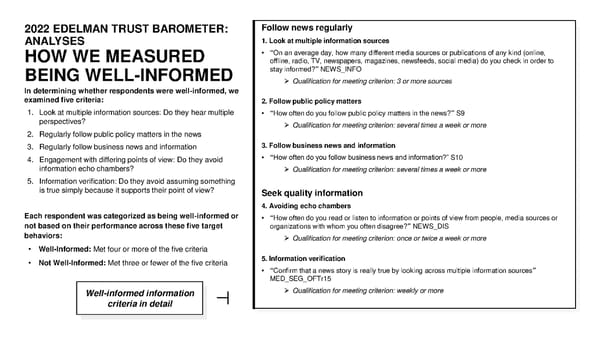
2022 EDELMAN TRUST BAROMETER: Follow news regularly ANALYSES 1. Look at multiple information sources HOW WE MEASURED • “On an average day, how many different media sources or publications of any kind (online, offline, radio, TV, newspapers, magazines, newsfeeds, social media) do you check in order to BEING WELL-INFORMED stay informed?” NEWS_INFO ➢ Qualification for meeting criterion: 3 or more sources In determining whether respondents were well-informed, we examined five criteria: 2. Follow public policy matters 1. Look at multiple information sources: Do they hear multiple • “How often do you follow public policy matters in the news?” S9 perspectives? ➢ Qualification for meeting criterion: several times a week or more 2. Regularly follow public policy matters in the news 3. Regularly follow business news and information 3. Follow business news and information 4. Engagement with differing points of view: Do they avoid • “How often do you follow business news and information?” S10 information echo chambers? ➢ Qualification for meeting criterion: several times a week or more 5. Information verification: Do they avoid assuming something is true simply because it supports their point of view? Seek quality information 4. Avoiding echo chambers Each respondent was categorized as being well-informed or • “How often do you read or listen to information or points of view from people, media sources or not based on their performance across these five target organizations with whom you often disagree?” NEWS_DIS behaviors: ➢ Qualification for meeting criterion: once or twice a week or more • Well-Informed: Met four or more of the five criteria • Not Well-Informed: Met three or fewer of the five criteria 5. Information verification • “Confirm that a news story is really true by looking across multiple information sources” MED_SEG_OFTr15 Well-informed information ➢ Qualification for meeting criterion: weekly or more criteria in detail
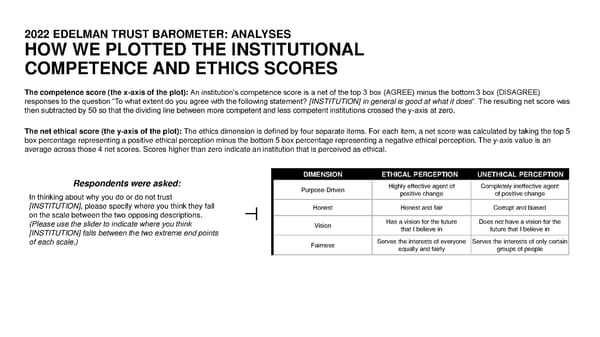
2022 EDELMAN TRUST BAROMETER: ANALYSES HOW WE PLOTTED THE INSTITUTIONAL COMPETENCE AND ETHICS SCORES The competence score (the x-axis of the plot): An institution’s competence score is a net of the top 3 box (AGREE) minus the bottom 3 box (DISAGREE) responses to the question “To what extent do you agree with the following statement? [INSTITUTION] in general is good at what it does”. The resulting net score was then subtracted by 50 so that the dividing line between more competent and less competent institutions crossed the y-axis at zero. The net ethical score (the y-axis of the plot): The ethics dimension is defined by four separate items. For each item, a net score was calculated by taking the top 5 box percentage representing a positive ethical perception minus the bottom 5 box percentage representing a negative ethical perception. The y-axis value is an average across those 4 net scores. Scores higher than zero indicate an institution that is perceived as ethical. DIMENSION ETHICAL PERCEPTION UNETHICAL PERCEPTION Respondents were asked: Purpose-Driven Highly effective agent of Completely ineffective agent In thinking about why you do or do not trust positive change of positive change [INSTITUTION], please specify where you think they fall Honest Honest and fair Corrupt and biased on the scale between the two opposing descriptions. (Please use the slider to indicate where you think Vision Has a vision for the future Does not have a vision for the [INSTITUTION] falls between the two extreme end points that I believe in future that I believe in of each scale.) Fairness Serves the interests of everyone Serves the interests of only certain equally and fairly groups of people
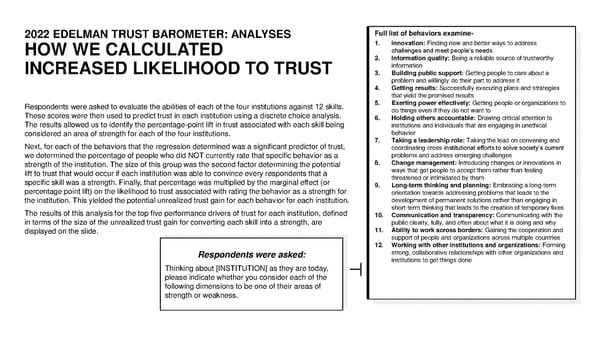
2022 EDELMAN TRUST BAROMETER: ANALYSES Full list of behaviors examine- 1. Innovation: Finding new and better ways to address HOW WE CALCULATED challenges and meet people’s needs 2. Information quality: Being a reliable source of trustworthy INCREASED LIKELIHOOD TO TRUST information 3. Building public support: Getting people to care about a problem and willingly do their part to address it 4. Getting results: Successfully executing plans and strategies that yield the promised results Respondents were asked to evaluate the abilities of each of the four institutions against 12 skills. 5. Exerting power effectively: Getting people or organizations to These scores were then used to predict trust in each institution using a discrete choice analysis. do things even if they do not want to The results allowed us to identify the percentage-point lift in trust associated with each skill being 6. Holding others accountable: Drawing critical attention to institutions and individuals that are engaging in unethical considered an area of strength for each of the four institutions. behavior Next, for each of the behaviors that the regression determined was a significant predictor of trust, 7. Taking a leadership role: Taking the lead on convening and coordinating cross-institutional efforts to solve society’s current we determined the percentage of people who did NOT currently rate that specific behavior as a problems and address emerging challenges strength of the institution. The size of this group was the second factor determining the potential 8. Change management:Introducing changes or innovations in lift to trust that would occur if each institution was able to convince every respondents that a ways that get people to accept them rather than feeling specific skill was a strength. Finally, that percentage was multiplied by the marginal effect (or threatened or intimidated by them percentage point lift) on the likelihood to trust associated with rating the behavior as a strength for 9. Long-term thinking and planning: Embracing a long-term orientation towards addressing problems that leads to the the institution. This yielded the potential unrealized trust gain for each behavior for each institution. development of permanent solutions rather than engaging in The results of this analysis for the top five performance drivers of trust for each institution, defined short-term thinking that leads to the creation of temporary fixes in terms of the size of the unrealized trust gain for converting each skill into a strength, are 10. Communication and transparency: Communicating with the public clearly, fully, and often about what it is doing and why displayed on the slide. 11. Ability to work across borders: Gaining the cooperation and support of people and organizations across multiple countries 12. Working with other institutions and organizations: Forming Respondents were asked: strong, collaborative relationships with other organizations and institutions to get things done Thinking about [INSTITUTION] as they are today, please indicate whether you consider each of the following dimensions to be one of their areas of strength or weakness.
2022 EDELMAN TRUST BAROMETER: FULL TEXT FOR ANSWER CHOICES ABBREVIATED SOCIETAL FEARS POP_EMO. Some people say they worry about many things while others say they have few concerns. We are interested in what you worry about. Specifically, how much do you worry about each of the following? Please indicate your answer using a nine-point scale where one means “I do not worry about this at all” and nine means “I am extremely worried about this”. Shortened Full Automation and/or other innovations taking your job away Job loss (net) Your job being moved to other countries where workers are paid less Cheaper foreign competitors driving companies like yours out of business Not having the training and skills necessary to get a good paying job Climate change Climate change leading to drought, rising sea levels and other natural disasters Hackers and cyber-attacks Hackers, cyber-attacks and cyber-terrorism Losing my freedom as a citizen Losing some of the rights and freedoms you have as a citizen of this country Experiencing prejudice or racism Experiencing prejudice, discrimination, or racism
2022 EDELMAN TRUST BAROMETER: FULL TEXT FOR ANSWER CHOICES ABBREVIATED EXPECTATIONS FOR CEOS CEO_RSP. For each of the following topics, please indicate to what degree corporate CEOs should be held responsible for directly helping to inform and shape ongoing conversations and policy debates. Shortened Full Jobs/economy Creating new, well-paying jobs How to strengthen and grow the economy Technology and automation Technology and automation’s impact on jobs Wage inequality Wage inequality Global warming and climate change Global warming and climate change Prejudice and discrimination Prejudice and discrimination Immigration and its impact on jobs Immigration and its impact on jobs Improving education and healthcare systems Improving the healthcare system Improving the education system How to increase the COVID vaccination rate How to increase the COVID vaccination rate Who the next leader of the country should be Who the next leader of the country should be
2022 EDELMAN TRUST BAROMETER: FULL TEXT FOR ANSWER CHOICES ABBREVIATED SOCIETAL ISSUES BUS_BND. Think about business as an institution, and its current level of engagement in addressing societal needs and issues. When it comes to each of the following areas, please indicate if you think business is going too far and overstepping what it should be doing, is doing just the right amount in regard to this activity or is not going far enough in its actions and should be doing more. Shortened Full Climate change Addressing climate change Economic inequality Redressing economic inequality, narrowing the opportunity gaps between the richest and poorest in this country, and lifting people out of poverty Workforce reskilling Doing the workforce reskilling and retraining necessary to keep people employable whose jobs are being eliminated or greatly altered by automation and artificial intelligence Access to healthcare Increasing access to good quality healthcare Trustworthy information Controlling the malicious spreading of misleading and false information and ensuring the availability of trustworthy information Systemic injustice Addressing systemic injustice and discrimination in this country based on race, gender, religion, or sexual orientation
2022 EDELMAN TRUST BAROMETER: FULL TEXT FOR ANSWER CHOICES ABBREVIATED DIMENSIONS OF TRUST CMP_ARE_[INS]. Thinking about ____ as they are today, please indicate whether you consider each of the following dimensions to be one of their areas of strength or weakness. Shortened Full Information quality Information quality: Being a reliable source of trustworthy information Hold others accountable Holding others accountable: Drawing critical attention to institutions and individuals that are engaging in unethical behavior Communication and transparency Communication and transparency: Communicating with the public clearly, fully, and often about what it is doing and why Exert power effectively Exerting power effectively: Getting people or organizations to do things even if they do not want to Get results Getting results: Successfully executing plans and strategies that yield the promised results Work with other institutions and organizations Working with other institutions and organizations: Forming strong, collaborative relationships with other organizations and institutions to get things done Take a leadership role Taking a leadership role: Taking the lead on convening and coordinating cross-institutional efforts to solve society’s current problems and address emerging challenges Change management Change management: Introducing changes or innovations in ways that get people to accept them rather than feeling threatened or intimidated by them Long-term thinking and planning: Embracing a long-term orientation towards addressing problems that leads to Long-term thinking and planning the development of permanent solutions rather than engaging in short-term thinking that leads to the creation of temporary fixes
2022 EDELMAN TRUST BAROMETER TEAM PROJECT TEAM ADVISORS Executive Director Tonia E. Ries Richard Edelman tonia.ries@edelman.com Kirsty Graham Executive Advisors Stephen Kehoe Head of Thought David M. Bersoff, Ph.D. Deborah Lehr Leadership Research david.bersoff@edelmandxi.com Dave Samson DXI Research Advisors Antoine Harary Project Director Sarah Adkins Yannis Kotziagkiaouridis Cody Armstrong Research Abbey Fox Claire Ritzmann MARKETING Data and Analysis John Zamites Executive Editor Nancy Jeffrey Vanessa Pymble Esther Choi Mike Bush Content Strategy Chloe Buckley Polly Mingledorff Brooke Walker Marketing Francesca Oddo-Budinoff Ryann Gastwirth Justin Blake Pamela Blandon Christopher Alessi Daniella Timmons Edelman Trust Institute Caitlin Semo Romain Maradan Susannah Ferris Design David Sookochoff
2022 EDELMAN TRUST BAROMETER SPECIAL REPORTS
COVER IMAGE CREDITS 1. New German Government Official Transfer: Sean Gallup via Getty Images 2. Trump Protest at Capitol: Bill Clark/CQ-Roll Call, Inc via Getty Images 2 3 3. Jeff Bezos' Blue Origin New Shepard Space Vehicle Flies The Billionaire And Other Passengers 1 To Space: Joe Raedlevia Getty Images 4. Defaced Mural Of Marcus Rashford Repaired By The Artist In Manchester: Christopher Furlong via 5 Getty Images 4 5. The "Changci" Ship Blocking The Suez Canal Repaired Set Sail: Zhang Jingang/ Costfoto/Barcroft Media via Getty Images 8 6. Scene of Beijing ahead of 2022 Winter Olympics: Kyodo News vis Getty Images 7. Spain-US-Afghanistan-Conflict-Evacuation: Cristina Quicler/AFPviaGetty Images 6 8. Australia-Health-Virus-Protest: David Gray/AFP via Getty Images 7 9 9. Topshot-Greece-Fire: AngelosTzortzinis/AFP via Getty Images DIVIDER IMAGE CREDITS Slide 4 Government and Media Fuel a Cycle of Distrust A photographer takes a picture as World Health Organization (WHO) Director-General Tedros Adhanom Ghebreyesus (on screen) speaks during a press conference on December 20, 2021 at the WHO headquarters in Geneva: Fabrice Coffrini/AFP via Getty Images Slide 13 Failure of Leadership Makes Distrust the Default Protestors hold placards that say Betrayed by my government during the demonstration: Belinda Jiao/SOPA Images/LightRocket via Getty Images) Slide 20 Collapse of Trust in Democracies Trump supporters stand on the U.S. Capitol Police armored vehicle as others take over the steps of the Capitol on Wednesday, Jan. 6, 2021, as the Congress works to certify the electoral college votes: Bill Clark/CQ-Roll Call, Inc via Getty Images Slide 25 Societal leadership Now a Core Business Function Employees install new solar panels at the Kalyon Energy's Karapinar Solar Power Plant on December 02, 2021 in Karapinar,Turkey: Chris McGrath/Getty Images Slide 31 Breaking the Cycle of Distrust The doctor gave the little girl a shot: ViewStock via Getty Images