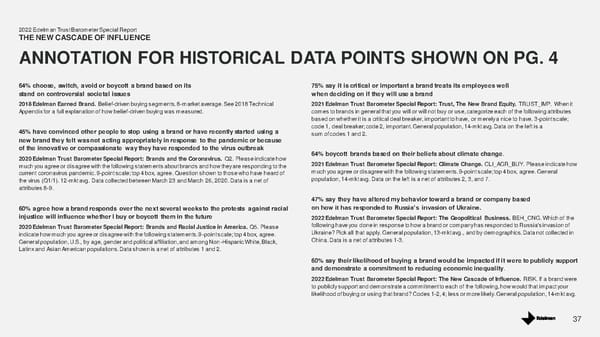
37 64% choose, switch, avoid or boycott a brand based on its stand on controversial societal issues 2018 Edelman Earned Brand. Belief - driven buying segments. 8 - market average. See 2018 Technical Appendix for a full explanation of how belief - driven buying was measured. 45% have convinced other people to stop using a brand or have recently started using a new brand they felt was not acting appropriately in response to the pandemic or because of the innovative or compassionate way they have responded to the virus outbreak 2020 Edelman Trust Barometer Special Report: Brands and the Coronavirus. Q2. Please indicate how much you agree or disagree with the following statements about brands and how they are responding to the current coronavirus pandemic. 9 - point scale; top 4 box, agree. Question shown to those who have heard of the virus (Q1/1). 12 - mkt avg. Data collected between March 23 and March 26, 2020. Data is a net of attributes 8 - 9. 60% agree how a brand responds over the next several weeks to the protests against racial injustice will influence whether I buy or boycott them in the future 2020 Edelman Trust Barometer Special Report: Brands and Racial Justice in America. Q5. Please indicate how much you agree or disagree with the following statements. 9 - point scale; top 4 box, agree. General population, U.S., by age, gender and political affiliation, and among Non - Hispanic White, Black, Latinx and Asian American populations. Data shown is a net of attributes 1 and 2. 75% say it is critical or important a brand treats its employees well when deciding on if they will use a brand 2021 Edelman Trust Barometer Special Report: Trust, The New Brand Equity. TRUST_IMP. When it comes to brands in general that you will or will not buy or use, categorize each of the following attributes bas ed on whether it is a critical deal breaker, im portant to have, or m erely a nice to have. 3 - point scale; code 1, deal breaker; code 2, important. General population, 14 - mkt avg. Data on the left is a sum of codes 1 and 2. 64% boycott brands based on their beliefs about climate change . 2021 Edelman Trust Barometer Special Report: Climate Change. CLI_AGR_BUY. Please indicate how much you agree or disagree with the following statements. 9 - point scale; top 4 box, agree. General population, 14 - mkt avg. Data on the left is a net of attributes 2, 3, and 7. 47% say they have altered my behavior toward a brand or company based on how it has responded to Russia’s invasion of Ukraine. 2022 Edelman Trust Barometer Special Report: The Geopolitical Business. BEH_CNG. Which of the following have you done in response to how a brand or company has responded to Russia's invasion of Ukraine? Pick all that apply. General population, 13 - mkt avg., and by demographics. Data not collected in China. Data is a net of attributes 1 - 3. 60% say their likelihood of buying a brand would be impacted if it were to publicly support and demonstrate a commitment to reducing economic inequality . 2022 Edelman Trust Barometer Special Report: The New Cascade of Influence. RISK. If a brand were to publicly s upport and dem onstrate a com m itment to each of the following, how would that im pact your likelihood of buying or using that brand? Codes 1 - 2, 4; less or more likely. General population, 14 - mkt avg. 2022 Edelman Trust Barometer Special Report THE NEW CASCADE OF INFLUENCE ANNOTATION FOR HISTORICAL DATA POINTS SHOWN ON PG. 4
 The New Cascade of Influence Page 36 Page 38