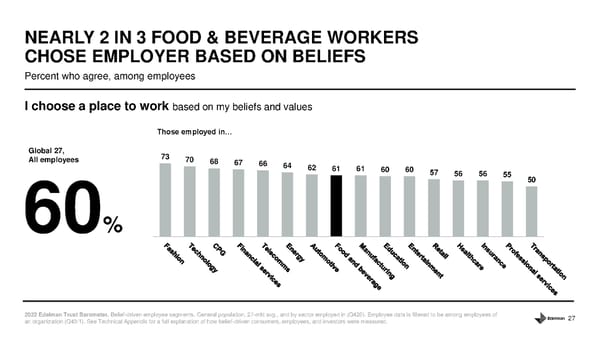
27 73 70 68 67 66 64 62 61 61 60 60 57 56 56 55 50 Percent who agree, among employees NEARLY 2 IN 3 FOOD & BEVERAGE WORKERS CHOSE EMPLOYER BASED ON BELIEFS 2022 Edelman Trust Barometer. Belief - driven employee segments. General population, 27 - mkt avg., and by sector employed in (Q420). Employee data is filtered to be among employees of an organization (Q43/1). See Technical Appendix for a full explanation of how belief - driven consumers, employees, and investors were measured. I choose a place to work based on my beliefs and values 60 % Global 27, All employees Those employed in...
 Food and Beverage Sector Page 26 Page 28