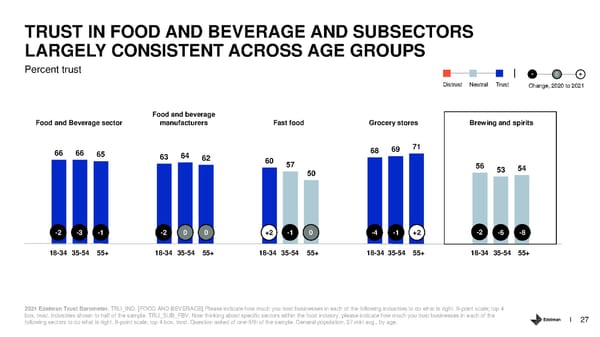
TRUST IN FOOD AND BEVERAGE AND SUBSECTORS LARGELY CONSISTENT ACROSS AGE GROUPS Percent trust - 0 + Distrust Neutral Trust Change, 2020 to 2021 Food and beverage Food and Beverage sector manufacturers Fast food Grocery stores Brewing and spirits 66 66 65 68 69 71 63 64 62 60 57 56 53 54 50 -2 -3 -1 -2 0 0 +2 -1 0 -4 -1 +2 -2 -6 -8 18-34 35-54 55+ 18-34 35-54 55+ 18-34 35-54 55+ 18-34 35-54 55+ 18-34 35-54 55+ 2021 Edelman Trust Barometer. TRU_IND. [FOOD AND BEVERAGE] Please indicate how much you trust businesses in each of the following industries to do what is right. 9-point scale; top 4 box, trust. Industries shown to half of the sample. TRU_SUB_FBV. Now thinking about specific sectors within the food industry, please indicate how much you trust businesses in each of the following sectors to do what is right. 9-point scale; top 4 box, trust. Question asked of one-fifth of the sample. General population, 27-mkt avg., by age. 27
 Trust and the Food and Beverage Sector Page 26 Page 28