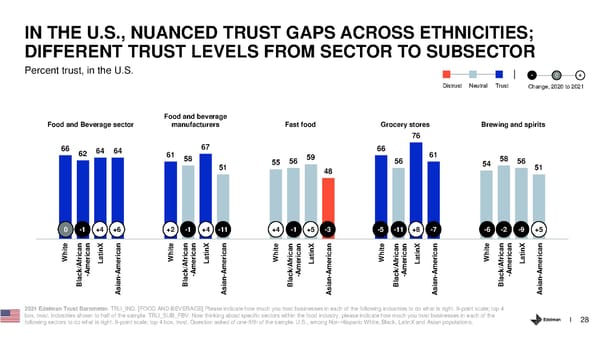
IN THE U.S., NUANCED TRUST GAPS ACROSS ETHNICITIES; DIFFERENT TRUST LEVELS FROM SECTOR TO SUBSECTOR Percent trust, in the U.S. - 0 + Distrust Neutral Trust Change, 2020 to 2021 Food and beverage Food and Beverage sector manufacturers Fast food Grocery stores Brewing and spirits 76 66 62 64 64 61 67 66 61 58 55 56 59 56 54 58 56 51 48 51 0 -1 +4 +6 +2 -1 +4 -11 +4 -1 +5 -3 -5 -11 +8 -7 -6 -2 -9 +5 et n n nX n te n n nX n te n n nX n te n n nX n te n n nX n carica ati ca ricaca ti ca ricaca ca ricaca ti ca ricaca ti ca Whi f L Whi f La Whi f Lati Whi f La Whi f La k/AAmeri Ameri k/AAmeri Ameri k/AAmeri Ameri k/A Ameri Ameri k/AAmeri Ameri acl- - lac- - lac- - lac - - lac- - B sian B sian B sian B sian B sian A A A A A 2021 Edelman Trust Barometer. TRU_IND. [FOOD AND BEVERAGE] Please indicate how much you trust businesses in each of the following industries to do what is right. 9-point scale; top 4 box, trust. Industries shown to half of the sample. TRU_SUB_FBV. Now thinking about specific sectors within the food industry, please indicate how much you trust businesses in each of the following sectors to do what is right. 9-point scale; top 4 box, trust. Question asked of one-fifth of the sample. U.S., among Non-Hispanic White, Black, LatinX and Asian populations. 28
 Trust and the Food and Beverage Sector Page 27 Page 29