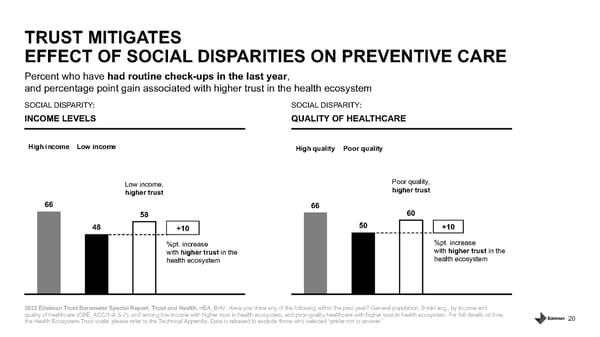
20 Percent who have had routine check - ups in the last year , and percentage point gain associated with higher trust in the health ecosystem TRUST MITIGATES EFFECT OF SOCIAL DISPARITIES ON PREVENTIVE CARE 2022 Edelman Trust Barometer Special Report: Trust and Health. HEA_BHV . Have you done any of the following within the past year? General population, 9 - mkt avg., by income and quality of healthcare (CRE_ACC/1 - 4; 5 - 7); and among low income with higher trust in health ecosystem, and poor - quality healthcar e with higher trust in health ecosystem. For full details on how the Health Ecosystem Trust scale, please refer to the Technical Appendix. Data is rebased to exclude those who selected “prefer not to answer.” 66 48 58 High income Low income 66 50 60 High quality Poor quality %pt. increase with higher trust in the health ecosystem +10 Low income, higher trust %pt. increase with higher trust in the health ecosystem +10 Poor quality, higher trust SOCIAL DISPARITY: INCOME LEVELS SOCIAL DISPARITY: QUALITY OF HEALTHCARE
 Trust and Health Page 19 Page 21