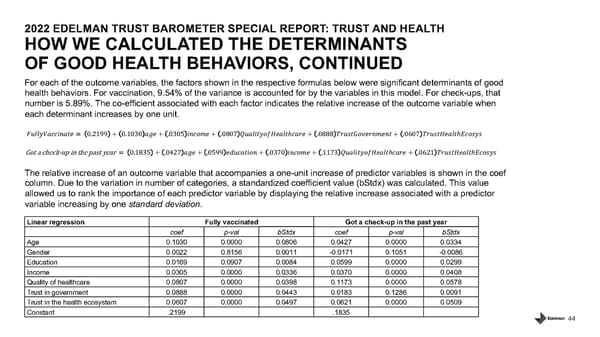
44 2022 EDELMAN TRUST BAROMETER SPECIAL REPORT: TRUST AND HEALTH HOW WE CALCULATED THE DETERMINANTS OF GOOD HEALTH BEHAVIORS, CONTINUED For each of the outcome variables, the factors shown in the respective formulas below were significant determinants of good health behaviors. For vaccination, 9.54% of the variance is accounted for by the variables in this model. For check - ups, that number is 5.89%. The co - efficient associated with each factor indicates the relative increase of the outcome variable when each determinant increases by one unit. Linear regression Fully vaccinated Got a check - up in the past year coef p - val bStdx coef p - val bStdx Age 0.1030 0.0000 0.0806 0.0427 0.0000 0.0334 Gender 0.0022 0.8156 0.0011 - 0.0171 0.1051 - 0.0086 Education 0.0169 0.0907 0.0084 0.0599 0.0000 0.0299 Income 0.0305 0.0000 0.0336 0.0370 0.0000 0.0408 Quality of healthcare 0.0807 0.0000 0.0398 0.1173 0.0000 0.0578 Trust in government 0.0888 0.0000 0.0443 0.0183 0.1286 0.0091 Trust in the health ecosystem 0.0607 0.0000 0.0497 0.0621 0.0000 0.0509 Constant .2199 .1835 𝐹𝑢𝑙𝑙𝑦𝑉𝑎𝑐𝑐𝑖𝑛𝑎𝑡𝑒 = 0 . 2199 + 0 . 1030 𝑎𝑔𝑒 + . 0305 𝑖𝑛𝑐𝑜𝑚𝑒 + . 0807 𝑄𝑢𝑎𝑙𝑖𝑡𝑦𝑜𝑓𝐻𝑒𝑎𝑙𝑡ℎ𝑐𝑎𝑟𝑒 + . 0888 𝑇𝑟𝑢𝑠𝑡𝐺𝑜𝑣𝑒𝑟𝑛𝑚𝑒𝑛𝑡 + . 0607 𝑇𝑟𝑢𝑠𝑡𝐻𝑒𝑎𝑙𝑡ℎ𝐸𝑐𝑜𝑠𝑦𝑠 Got a check - up in the past year = 0 . 1835 + . 0427 𝑎𝑔𝑒 + . 0599 𝑒𝑑𝑢𝑐𝑎𝑡𝑖𝑜𝑛 + . 0370 𝑖𝑛𝑐𝑜𝑚𝑒 + . 1173 𝑄𝑢𝑎𝑙𝑖𝑡𝑦𝑜𝑓𝐻𝑒𝑎𝑙𝑡ℎ𝑐𝑎𝑟𝑒 + . 0621 𝑇𝑟𝑢𝑠𝑡𝐻𝑒𝑎𝑙𝑡ℎ𝐸𝑐𝑜𝑠𝑦𝑠 The relative increase of an outcome variable that accompanies a one - unit increase of predictor variables is shown in the coef column. Due to the variation in number of categories, a standardized coefficient value ( bStdx ) was calculated. This value allowed us to rank the importance of each predictor variable by displaying the relative increase associated with a predictor variable increasing by one standard deviation .
 Trust and Health Page 43 Page 45