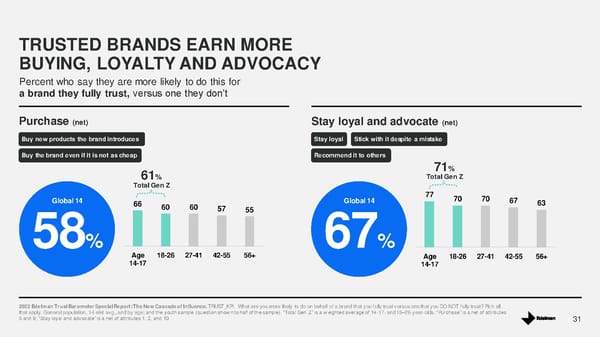
Percent who say they are more likely to do this for a brand they fully trust, versus one they don’t TRUSTED BRANDS EARN MORE BUYING, LOYALTY AND ADVOCACY Purchase (net) Stay loyal and advocate (net) 66 60 60 57 55 Age 14-17 18-26 27-41 42-55 56+ 31 Stay loyal Stick with it despite a mistake 58 % Global 14 Buy new products the brand introduces Buy the brand even if it is not as cheap 61 % Total Ge n Z Recommend it to others 77 70 70 67 63 Age 14-17 18-26 27-41 42-55 56+ 67 % Global 14 7 1 % Total Ge n Z 2022 Edelm an Trust Barometer Special Report: The New Cascade of Influence. TRUST_KPI. What are you more likely to do on behalf of a brand that you f ully trust versus one that you DO NOT f ully trust? P ick all that apply. General population, 14 - mkt avg., and by age; and the youth sample (question show n to half of the sample). “Total Gen Z” is a w eighted average of 14 - 17 - and 18 – 26 - year - olds . “Purchase” is a net of attributes 5 and 9; “Stay loyal and advocate” is a net of attributes 1, 2, and 10.
 The New Cascade of Influence Page 30 Page 32