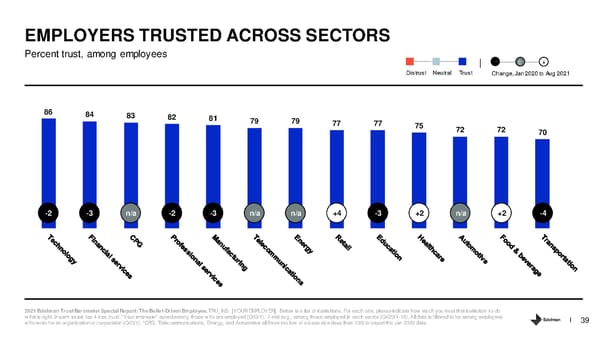
EMPLOYERS TRUSTED ACROSS SECTORS Percent trust, among employees - 0 + Distrust Neutral Trust Change, Jan 2020 to Aug 2021 86 84 83 82 81 79 79 77 77 75 72 72 70 -2 -3 n/a -2 -3 n/a n/a +4 -3 +2 n/a +2 -4 2021 Edelman Trust Barometer Special Report: The Belief-Driven Employee. TRU_INS. [YOUR EMPLOYER] Below is a list of institutions. For each one, please indicate how much you trust that institution to do what is right. 9-point scale; top 4 box, trust. “Your employer” asked among those who are employed (Q43/1). 7-mkt avg., among those employed in each sector (Q420/1-18). All data is filtered to be among employees who work for an organization or corporation (Q43/1). *CPG, Telecommunications, Energy, and Automotive all have too low of a basesize (less than 100) to report the Jan 2020 data. 39
 The Belief Driven Employee Page 38 Page 40