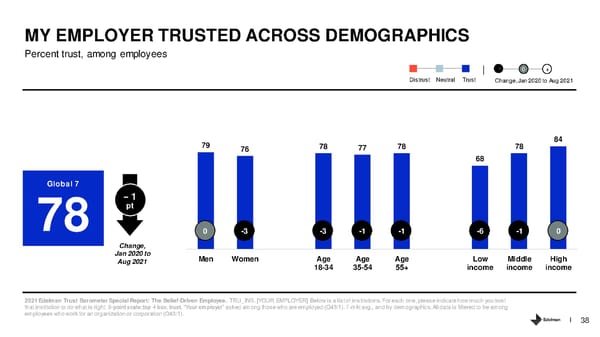
MY EMPLOYER TRUSTED ACROSS DEMOGRAPHICS Percent trust, among employees - 0 + Distrust Neutral Trust Change, Jan 2020 to Aug 2021 79 78 78 78 84 76 77 68 Global 7 -- 1 78 pt 0 -3 -3 -1 -1 -6 -1 0 Change, Jan 2020 to Men Women Age Age Age Low Middle High Aug 2021 18-34 35-54 55+ income income income 2021 Edelman Trust Barometer Special Report: The Belief-Driven Employee. TRU_INS. [YOUR EMPLOYER] Below is a list of institutions. For each one, please indicate how much you trust that institution to do what is right. 9-point scale; top 4 box, trust. “Your employer” asked among those who are employed (Q43/1).7-mkt avg., and by demographics. All data is filtered to be among employees who work for an organization or corporation (Q43/1). 38
 The Belief Driven Employee Page 37 Page 39