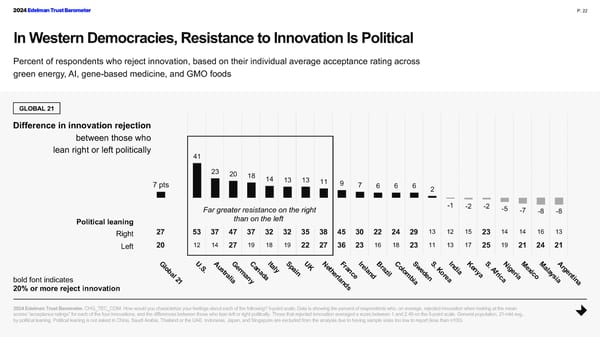
2024 Edelman Trust Barometer P. 22 In Western Democracies, Resistance to Innovation Is Political Percent of respondents who reject innovation, based on their individual average acceptance rating across green energy, AI, gene-based medicine, and GMO foods GLOBAL 21 Difference in innovation rejection between those who lean right or left politically 41 23 20 18 7 pts 14 13 13 11 9 7 6 6 6 2 Far greater resistance on the right -1 -2 -2 -5 -7 -8 -8 Political leaning than on the left Right 27 53 37 47 37 32 32 35 38 45 30 22 24 29 13 12 15 23 14 14 16 13 Left 20 12 14 27 19 18 19 22 27 36 23 16 18 23 11 13 17 25 19 21 24 21 Gl U. Au Ge Ca It Sp UK Ne Fr Ir Br Co Sw S. In Ke S. Ni Me Ma Ar o S a a e a d g g s r n ly a t n la l e K ia n A x l b . t m a in h n z o d o y f e i a e a r e c i m r r c y n a a d r e d l e r a i i o s l l n a l b n e c a i ti 2 i a a a a n bold font indicates 1 a y n i 20% or more reject innovation ds a a 2024 Edelman Trust Barometer. CHG_TEC_COM. How would you characterize your feelings about each of the following? 5-point scale; Data is showing the percent of respondents who, on average, rejected innovation when looking at the mean scores “acceptance ratings” for each of the four innovations, and the differences between those who lean left or right politically. Those that rejected innovation averaged a score between 1 and 2.49 on the 5-point scale. General population, 21-mkt avg., by political leaning. Political leaning is not asked in China, Saudi Arabia, Thailand or the UAE. Indonesia, Japan, and Singapore are excluded from the analysis due to having sample sizes too low to report (less than n100).
 2024 Edelman Trust Barometer Global Report Page 21 Page 23