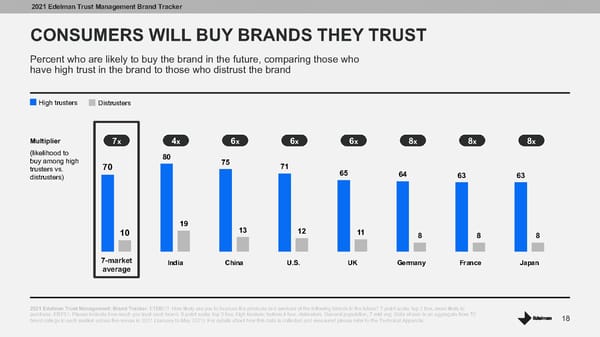
2021 Edelman Trust Management Brand Tracker CONSUMERS WILL BUY BRANDS THEY TRUST Percent who are likely to buy the brand in the future, comparing those who have high trust in the brand to those who distrust the brand High trusters Distrusters Multiplier 7x 4x 6x 6x 6x 8x 8x 8x (likelihood to 80 buy among high 70 75 71 trusters vs. 65 64 63 63 distrusters) 19 13 12 10 11 8 8 8 7-market India China U.S. UK Germany France Japan average 2021 Edelman Trust Management: Brand Tracker. ETMB13. How likely are you to buy/use the products and services of the following brands in the future? 7-point scale; top 2 box, more likely to purchase. EBTS1. Please indicate how much you trust each brand. 9-point scale; top 3 box, high trusters; bottom 4 box, distrusters. General population, 7-mkt avg. Data shown is an aggregate from 70 18 brand ratings in each market across five waves in 2021 (January to May 2021). For details about how this data is collected and measured please refer to the Technical Appendix.
 Trust The New Brand Equity Page 17 Page 19