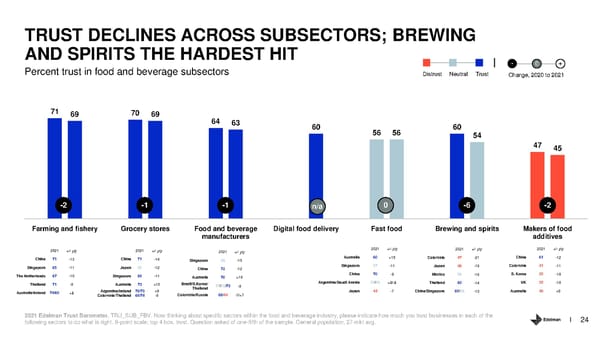
TRUST DECLINES ACROSS SUBSECTORS; BREWING AND SPIRITS THE HARDEST HIT Percent trust in food and beverage subsectors - 0 + Distrust Neutral Trust Change, 2020 to 2021 71 69 70 69 64 63 60 60 56 56 54 47 45 -2 -1 -1 n/a 0 -6 -2 Farming and fishery Grocery stores Food and beverage Digital food delivery Fast food Brewing and spirits Makers of food manufacturers additives 2021 +/- yty 2021 +/- yty 2021 +/- yty 2021 +/- yty 2021 +/- yty 2021 +/- yty China 71 -13 China 71 -14 Singapore 58 -15 Australia 60 +15 Colombia 47 -21 China 61 -12 Singapore 65 -11 Japan 55 -12 China 72 -12 Singapore 57 -11 Japan 46 -16 Colombia 41 -11 The Netherlands 67 -10 Singapore 69 -11 Australia 70 +10 China 70 -9 Mexico 56 -16 S. Korea 35 -10 Thailand 71 -9 Australia 73 +10 Brazil/S.Korea/ 57/53/73 -9 Argentina/Saudi Arabia 55/58 +8/-8 Thailand 60 -14 UK 35 -10 Argentina/Ireland 70/73 +9 Thailand Japan 44 -7 China/Singapore 69/58 -13 Australia 49 +9 Australia/Ireland 74/69 +8 Colombia/Thailand 69/74 -9 Colombia/Russia 66/44 -7/+7 2021 Edelman Trust Barometer. TRU_SUB_FBV. Now thinking about specific sectors within the food and beverage industry, please indicate how much you trust businesses in each of the following sectors to do what is right. 9-point scale; top 4 box, trust. Question asked of one-fifth of the sample. General population, 27-mkt avg. 24
 Trust and the Food and Beverage Sector Page 23 Page 25