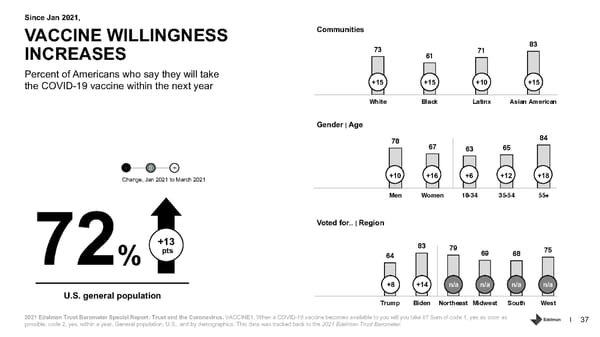
Since Jan 2021, VACCINE WILLINGNESS Communities 73 71 83 INCREASES 61 Percent of Americans who say they will take the COVID-19 vaccine within the next year +15 +15 +10 +15 White Black Latinx Asian American Gender |Age 78 84 67 63 65 - 0 + +10 +16 +6 +12 +18 Change, Jan 2021 to March 2021 Men Women 18-34 35-54 55+ Voted for.. | Region +13 83 79 75 72% pts 64 69 68 +8 +14 n/a n/a n/a n/a U.S. general population Trump Biden Northeast Midwest South West 2021 Edelman Trust Barometer Special Report: Trust and the Coronavirus. VACCINE1. When a COVID-19 vaccine becomes available to you will you take it? Sum of code 1, yes as soon as possible; code 2, yes, within a year. General population, U.S., and by demographics. This data was tracked back to the 2021 Edelman Trust Barometer. 37
 Trust and the Coronavirus in the US. Page 36 Page 38