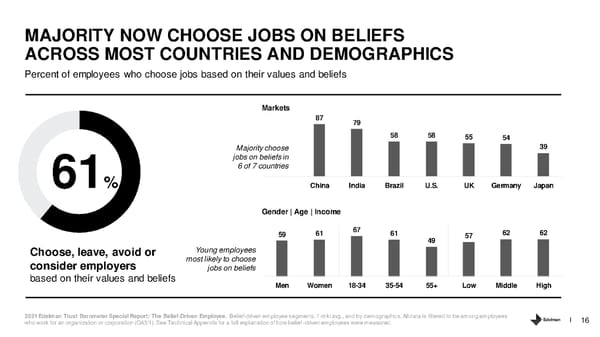
MAJORITY NOW CHOOSE JOBS ON BELIEFS ACROSS MOST COUNTRIES AND DEMOGRAPHICS Percent of employees who choose jobs based on their values and beliefs Markets 87 79 58 58 55 54 Majority choose 39 jobs on beliefs in 61% 6 of 7 countries China India Brazil U.S. UK Germany Japan Gender | Age | Income 59 61 67 61 57 62 62 49 Choose, leave, avoid or Young employees consider employers most likely to choose jobs on beliefs based on their values and beliefs Men Women 18-34 35-54 55+ Low Middle High 2021 Edelman Trust Barometer Special Report: The Belief-Driven Employee. Belief-driven employee segments. 7-mkt avg., and by demographics. All data is filtered to be among employees who work for an organization or corporation (Q43/1). See Technical Appendix for a full explanation of how belief-driven employees were measured. 16
 The Belief Driven Employee Page 15 Page 17