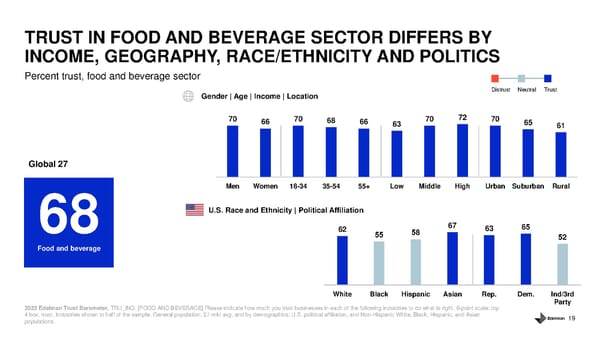
19 Percent trust, food and beverage sector TRUST IN FOOD AND BEVERAGE SECTOR DIFFERS BY INCOME, GEOGRAPHY, RACE/ETHNICITY AND POLITICS Distrust Neutral Trust 70 66 70 68 66 63 70 72 70 65 61 Men Women 18-34 35-54 55+ Low Middle High Urban Suburban Rural 62 55 58 67 63 65 52 White Black Hispanic Asian Rep. Dem. Ind/3rd Party U.S. Race and Ethnicity | Political Affiliation Gender | Age | Income | Location Global 27 68 Food and beverage 2022 Edelman Trust Barometer. TRU_IND. [FOOD AND BEVERAGE] Please indicate how much you trust businesses in each of the following industries to do what is rig ht. 9 - point scale; top 4 box, trust. Industries shown to half of the sample. General population, 27 - mkt avg, and by demographics; U.S. political affili ation, and Non - Hispanic White, Black, Hispanic, and Asian populations .
 Food and Beverage Sector Page 18 Page 20