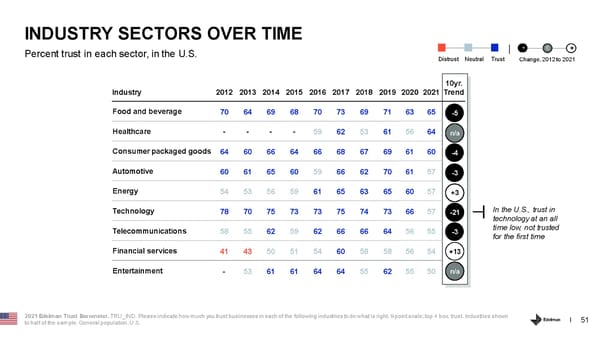
INDUSTRY SECTORS OVER TIME + - 0 Percent trust in each sector, in the U.S. Distrust Neutral Trust Change, 2012 to 2021 10yr. Industry 2012 2013 2014 2015 2016 2017 2018 2019 2020 2021 Trend Food and beverage 70 64 69 68 70 73 69 71 63 65 -5 Healthcare - - - - 59 62 53 61 56 64 n/a Consumer packaged goods 64 60 66 64 66 68 67 69 61 60 -4 Automotive 60 61 65 60 59 66 62 70 61 57 -3 Energy 54 53 56 59 61 65 63 65 60 57 +3 In the U.S., trust in Technology 78 70 75 73 73 75 74 73 66 57 -21 technology at an all time low; not trusted Telecommunications 58 55 62 59 62 66 66 64 56 55 -3 for the first time Financial services 41 43 50 51 54 60 58 58 56 54 +13 Entertainment - 53 61 61 64 64 55 62 55 50 n/a 2021 Edelman Trust Barometer. TRU_IND. Please indicate how much you trust businesses in each of the following industries to do what is right. 9-point scale; top 4 box, trust. Industries shown 51 to half of the sample. General population, U.S.
 Country Report - U.S. Page 50 Page 52