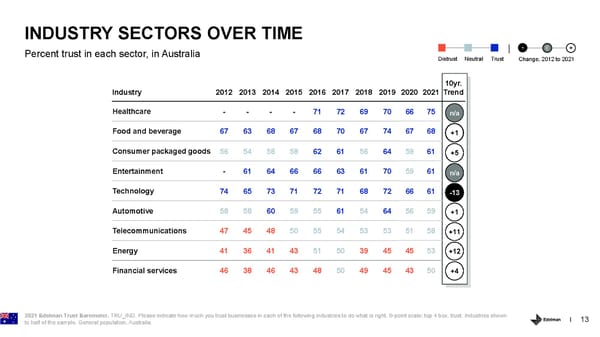
INDUSTRY SECTORS OVER TIME - 0 + Percent trust in each sector, in Australia Distrust Neutral Trust Change, 2012 to 2021 10yr. Industry 2012 2013 2014 2015 2016 2017 2018 2019 2020 2021 Trend Healthcare - - - - 71 72 69 70 66 75 n/a Food and beverage 67 63 68 67 68 70 67 74 67 68 +1 Consumer packaged goods 56 54 58 58 62 61 56 64 59 61 +5 Entertainment - 61 64 66 66 63 61 70 59 61 n/a Technology 74 65 73 71 72 71 68 72 66 61 -13 Automotive 58 58 60 59 55 61 54 64 56 59 +1 Telecommunications 47 45 48 50 55 54 53 53 51 58 +11 Energy 41 36 41 43 51 50 39 45 45 53 +12 Financial services 46 38 46 43 48 50 49 45 43 50 +4 2021 Edelman Trust Barometer. TRU_IND. Please indicate how much you trust businesses in each of the following industries to do what is right. 9-point scale; top 4 box, trust. Industries shown 13 to half of the sample. General population, Australia.
 Country Report - Australia Page 12 Page 14