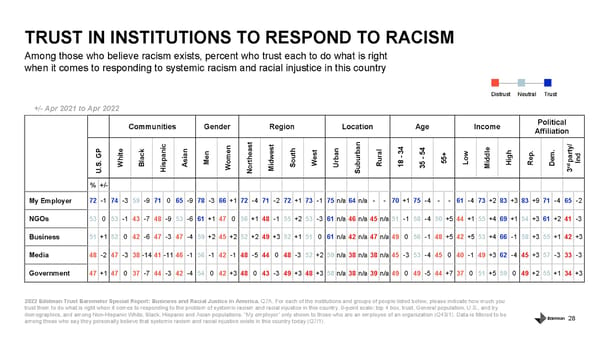
28 Among those who believe racism exists, percent who trust each to do what is right when it comes to responding to systemic racism and racial injustice in this country TRUST IN INSTITUTIONS TO RESPOND TO RACISM 2022 Edelman Trust Barometer Special Report: Business and Racial Justice in America. Q7A. For each of the institutions and groups of people listed below, please indicate how much you trust them to do what is right when it comes to responding to the problem of systemic racism and racial injustice in this countr y. 9 -point scale; top 4 box, trust. General population, U.S., and by demographics, and among Non-Hispanic White, Black, Hispanic and Asian populations. “My employer” only shown to those who are an employee of an organization (Q43/1). Data is filtered to be among those who say they personally believe that systemic racism and racial injustice exists in this country today (Q7/1). Communities Gender Region Location Age Income Political Affiliation U.S. GP White Black Hispanic Asian Men Women Northeast Midwest South West Urban Suburban Rural 18 - 34 35 - 54 55+ Low Middle High Rep. Dem. 3 rd party/ Ind % +/- My Employer 72 -1 74 -3 59 -9 71 0 65 -9 78 -3 66 +1 72 -4 71 -2 72 +1 73 -1 75 n/a 64 n/a - - 70 +1 75 -4 - - 61 -4 73 +2 83 +3 83 +9 71 -4 65 -2 NGOs 53 0 53 -1 43 -7 48 -9 53 -6 61 +1 47 0 56 +1 48 -1 55 +2 53 -3 61 n/a 46 n/a 45 n/a 51 -1 58 -4 50 +5 44 +1 55 +4 69 +1 54 +3 61 +2 41 -3 Business 51 +1 52 0 42 -6 47 -3 47 -4 59 +2 45 +2 52 +2 49 +3 52 +1 51 0 61 n/a 42 n/a 47 n/a 49 0 56 -1 48 +5 42 +5 53 +4 66 -1 58 +3 55 +1 42 +3 Media 48 -2 47 -3 38 -14 41 -11 46 -1 56 -1 42 -1 48 -5 44 0 48 -3 52 +2 59 n/a 38 n/a 38 n/a 45 -3 53 -4 45 0 40 -1 49 +3 62 -4 45 +3 57 -3 33 -3 Government 47 +1 47 0 37 -7 44 -3 42 -4 54 0 42 +3 48 0 43 -3 49 +3 48 +3 58 n/a 38 n/a 39 n/a 49 0 49 -5 44 +7 37 0 51 +5 59 0 49 +2 55 +1 34 +3 +/- Apr 2021 to Apr 2022 Distrust Neutral Trust
 Business and Racial Justice Page 27 Page 29