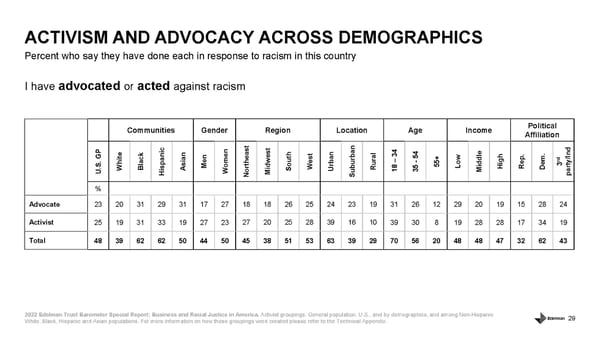
29 Percent who say they have done each in response to racism in this country ACTIVISM AND ADVOCACY ACROSS DEMOGRAPHICS 2022 Edelman Trust Barometer Special Report: Business and Racial Justice in America. Activist groupings. General population, U.S., and by demographics, and among Non-Hispanic White, Black, Hispanic and Asian populations . For more information on how these groupings were created please refer to the Technical Appendix. I have advocated or acted against racism Communities Gender Region Location Age Income Political Affiliation U.S. GP White Black Hispanic Asian Men Women Northeast Midwest South West Urban Suburban Rural 18 – 34 35 - 54 55+ Low Middle High Rep. Dem. 3 rd party/Ind % Advocate 23 20 31 29 31 17 27 18 18 26 25 24 23 19 31 26 12 29 20 19 15 28 24 Activist 25 19 31 33 19 27 23 27 20 25 28 39 16 10 39 30 8 19 28 28 17 34 19 Total 48 39 62 62 50 44 50 45 38 51 53 63 39 29 70 56 20 48 48 47 32 62 43
 Business and Racial Justice Page 28 Page 30