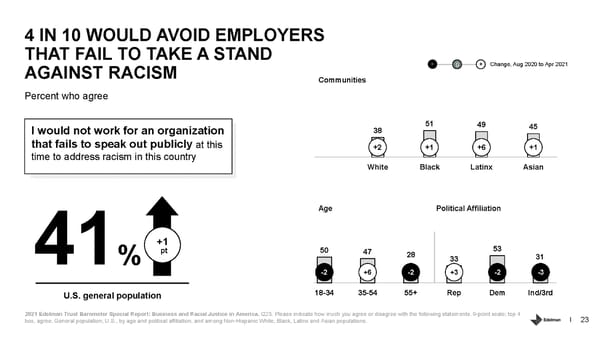
4 IN 10 WOULD AVOID EMPLOYERS THAT FAIL TO TAKE A STAND - + AGAINST RACISM 0 Change, Aug 2020 to Apr 2021 Communities Percent who agree I would not work for an organization 38 51 49 45 that fails to speak out publicly at this +2 +1 +6 +1 time to address racism in this country White Black Latinx Asian Age Political Affiliation +1 50 53 pt 47 28 31 41% 33 -2 +6 -2 +3 -2 -3 U.S. general population 18-34 35-54 55+ Rep Dem Ind/3rd 2021 Edelman Trust Barometer Special Report: Business and Racial Justice in America. Q23. Please indicate how much you agree or disagree with the following statements. 9-point scale; top 4 box, agree. General population, U.S., by age and political affiliation, and among Non-Hispanic White, Black, Latinx and Asian populations. 23
 Business and Racial Justice in America Page 22 Page 24