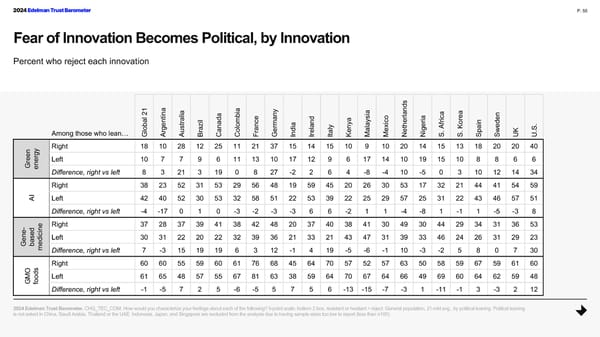
2024 Edelman Trust Barometer P. 55 Fear of Innovation Becomes Political, by Innovation Percent who reject each innovation s d 1 a a ia y a n a n i a n la n 2 i l b ca e l t a l d a d ysi r ia i r e a n r m ce n co e r r n d b e zi a n m a a ya a h e f i e . st n lo r i l y n l xi t A Ko a o g a a d l a e S Among those who lean… u r r e e . Gl Ar A B Ca Co F Ge In Ir Ita K M M Ne Nig S S. Sp Sw UK U. Right 18 10 28 12 25 11 21 37 15 14 15 10 9 10 20 14 15 13 18 20 20 40 n gy e e Left 10 7 7 9 6 11 13 10 17 12 9 6 17 14 10 19 15 10 8 8 6 6 Gr ener Difference, right vs left 8 3 21 3 19 0 8 27 -2 2 6 4 -8 -4 10 -5 0 3 10 12 14 34 Right 38 23 52 31 53 29 56 48 19 59 45 20 26 30 53 17 32 21 44 41 54 59 AI Left 42 40 52 30 53 32 58 51 22 53 39 22 25 29 57 25 31 22 43 46 57 51 Difference, right vs left -4 -17 0 1 0 -3 -2 -3 -3 6 6 -2 1 1 -4 -8 1 -1 1 -5 -3 8 - e Right 37 28 37 39 41 38 42 48 20 37 40 38 41 30 49 30 44 29 34 31 36 53 e d n ci n se i Left 30 31 22 20 22 32 39 36 21 33 21 43 47 31 39 33 46 24 26 31 29 23 a d Ge b e m Difference, right vs left 7 -3 15 19 19 6 3 12 -1 4 19 -5 -6 -1 10 -3 -2 5 8 0 7 30 O s Right 60 60 55 59 60 61 76 68 45 64 70 57 52 57 63 50 58 59 67 59 61 60 d GM o Left 61 65 48 57 55 67 81 63 38 59 64 70 67 64 66 49 69 60 64 62 59 48 fo Difference, right vs left -1 -5 7 2 5 -6 -5 5 7 5 6 -13 -15 -7 -3 1 -11 -1 3 -3 2 12 2024 Edelman Trust Barometer. CHG_TEC_COM. How would you characterize your feelings about each of the following? 5-point scale; bottom 2 box, resistant or hesitant = reject. General population, 21-mkt avg., by political leaning. Political leaning is not asked in China, Saudi Arabia, Thailand or the UAE. Indonesia, Japan, and Singapore are excluded from the analysis due to having sample sizes too low to report (less than n100).
 2024 Edelman Trust Barometer Global Report Page 54 Page 56