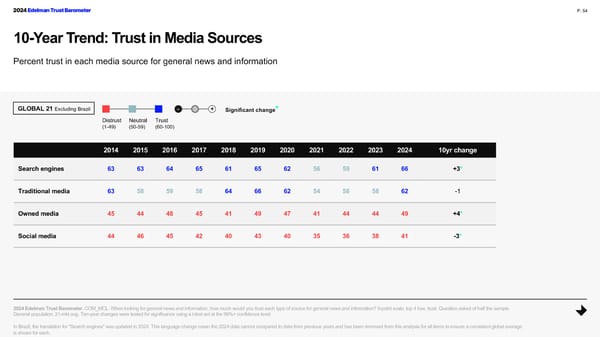
2024 Edelman Trust Barometer P. 54 10-Year Trend: Trust in Media Sources Percent trust in each media source for general news and information GLOBAL 21 Excluding Brazil - 0 + Significant change* Distrust Neutral Trust (1-49) (50-59) (60-100) 2014 2015 2016 2017 2018 2019 2020 2021 2022 2023 2024 10yr change Search engines 63 63 64 65 61 65 62 56 59 61 66 +3* Traditional media 63 58 59 58 64 66 62 54 58 58 62 -1 Owned media 45 44 48 45 41 49 47 41 44 44 49 +4* Social media 44 46 45 42 40 43 40 35 36 38 41 -3* 2024 Edelman Trust Barometer.COM_MCL. When looking for general news and information, how much would you trust each type of source for general news and information? 9-point scale; top 4 box, trust. Question asked of half the sample. General population, 21-mkt avg. Ten-year changes were tested for significance using a t-test set at the 99%+ confidence level. In Brazil, the translation for "Search engines" was updated in 2024. This language change mean the 2024 data cannot compared to data from previous years and has been removed from this analysis for all items to ensure a consistent global average is shown for each.
 2024 Edelman Trust Barometer Global Report Page 53 Page 55