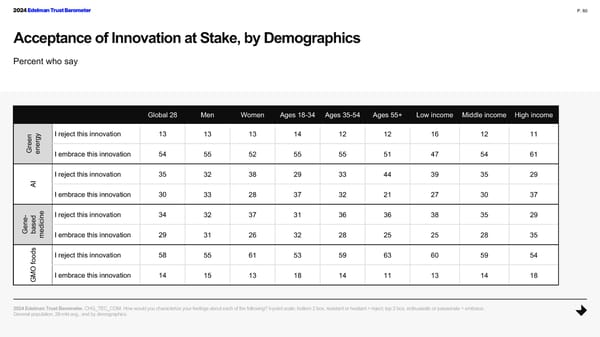
2024 Edelman Trust Barometer P. 60 Acceptance of Innovation at Stake, by Demographics Percent who say Global 28 Men Women Ages 18-34 Ages 35-54 Ages 55+ Low income Middle income High income I reject this innovation 13 13 13 14 12 12 16 12 11 n gy e e GrenerI embrace this innovation 54 55 52 55 55 51 47 54 61 AI I reject this innovation 35 32 38 29 33 44 39 35 29 I embrace this innovation 30 33 28 37 32 21 27 30 37 - e I reject this innovation 34 32 37 31 36 36 38 35 29 e d n ci n sei a d Ge b e I embrace this innovation 29 31 26 32 28 25 25 28 35 s m d I reject this innovation 58 55 61 53 59 63 60 59 54 o O fo I embrace this innovation 14 15 13 18 14 11 13 14 18 GM 2024 Edelman Trust Barometer. CHG_TEC_COM. How would you characterize your feelings about each of the following? 5-point scale; bottom 2 box, resistant or hesitant = reject; top 2 box, enthusiastic or passionate = embrace. General population, 28-mkt avg., and by demographics.
 2024 Edelman Trust Barometer Global Report Page 59 Page 61