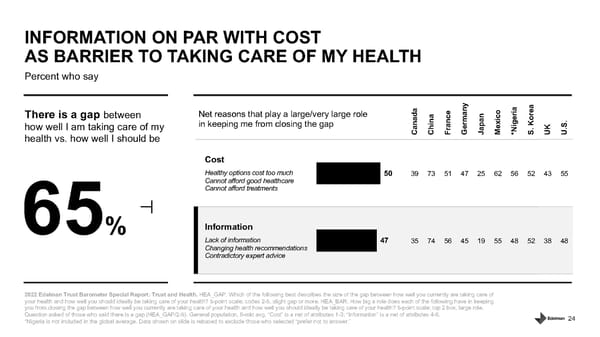
24 Percent who say INFORMATION ON PAR WITH COST AS BARRIER TO TAKING CARE OF MY HEALTH 2022 Edelman Trust Barometer Special Report: Trust and Health. HEA_GAP. Which of the following best describes the size of the gap between how well you currently are taking care of your health and how well you should ideally be taking care of your health? 5 - point scale; codes 2 - 5, slight gap or more. HEA_BAR. How big a role does each of the following have in keeping you from closing the gap between how well you currently are taking care of your health and how well you should ideally be taking care of your health? 5 - point scale; top 2 box, large role. Question asked of those who said there is a gap (HEA_GAP/2 - 5). General population, 9 - mkt avg. “Cost” is a net of attributes 1 - 3; “Information” is a net of attributes 4 - 6. *Nigeria is not included in the global average. Data shown on slide is rebased to exclude those who selected “prefer not to a nsw er.” 65 % There is a gap between how well I am taking care of my health vs. how well I should be Canada China France Germany Japan Mexico *Nigeria S. Korea UK U.S. Cost Healthy options cost too much Cannot afford good healthcare Cannot afford treatments 39 73 51 47 25 62 56 52 43 55 Information Lack of information Changing health recommendations Contradictory expert advice 35 74 56 45 19 55 48 52 38 48 Net reasons that play a large/very large role in keeping me from closing the gap 47 50
 Trust and Health Page 23 Page 25