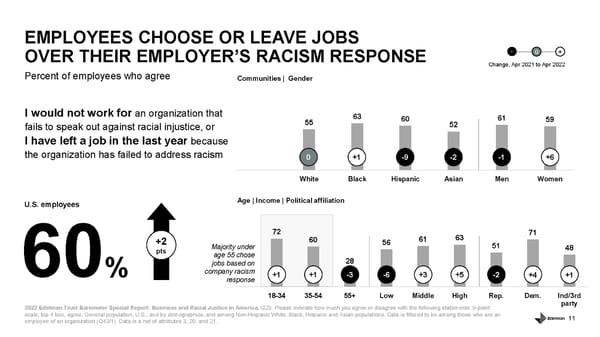
11 Percent of employees who agree EMPLOYEES CHOOSE OR LEAVE JOBS OVER THEIR EMPLOYER’S RACISM RESPONSE 2022 Edelman Trust Barometer Special Report: Business and Racial Justice in America. Q23. Please indicate how much you agree or disagree with the following statements. 9-point scale; top 4 box, agree. General population, U.S., and by demographics, and among Non-Hispanic White, Black, Hispanic and Asian populations. Data is filtered to be among those who are an employee of an organization (Q43/1). Data is a net of attributes 3, 20, and 21. I would not work for an organization that fails to speak out against racial injustice, or I have left a job in the last year because the organization has failed to address racism U.S. employees 60 % +2 pts Change, Apr 2021 to Apr 2022 - 0 + 55 63 60 52 61 59 White Black Hispanic Asian Men Women 72 60 28 56 61 63 51 71 48 18-34 35-54 55+ Low Middle High Rep. Dem. Ind/3rd party +1 +1 -3 -6 +3 +5 -2 +4 +1 0 +1 -9 -2 -1 +6 Communities | Gender Age | Income | Political affiliation Majority under age 55 chose jobs based on company racism response
 Business and Racial Justice Page 10 Page 12