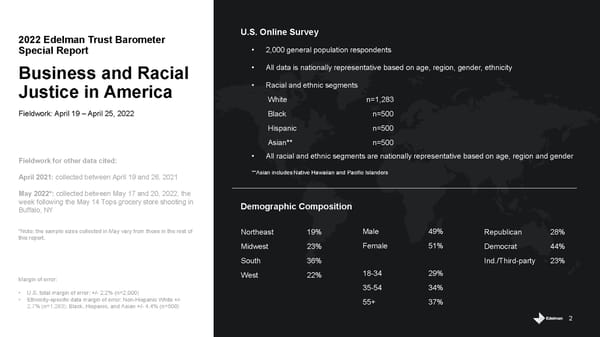
2 Margin of error: • U.S. total margin of error: +/ - 2.2% (n=2,000) • Ethnicity -specific data margin of error: Non-Hispanic White +/ - 2.7 % (n= 1,283) ; Black, Hispanic, and Asian +/ - 4.4% (n=500) 2022 Edelman Trust Barometer Special Report Business and Racial Justice in America Fieldwork: April 19 – April 25, 2022 U.S. Online Survey • 2,000 general population respondents • All data is nationally representative based on age, region, gender, ethnicity • Racial and ethnic segments • All racial and ethnic segments are nationally representative based on age, region and gender **Asian includes Native Hawaiian and Pacific Islanders Male 49% Female 51% 18- 34 29% 35- 54 34% 55+ 37% Demographic Composition Northeast 19% Midwest 23% South 36% West 22% Republican 28% Democrat 44% Ind./Third -party 23% White n=1,283 Black n=500 Hispanic n=500 Asian** n=500 Fieldwork for other data cited: April 2021: collected between April 19 and 26, 2021 May 2022*: collected between May 17 and 20, 2022, the week following the May 14 Tops grocery store shooting in Buffalo, NY *Note: the sample sizes collected in May vary from those in the rest of this report.
 Business and Racial Justice Page 1 Page 3