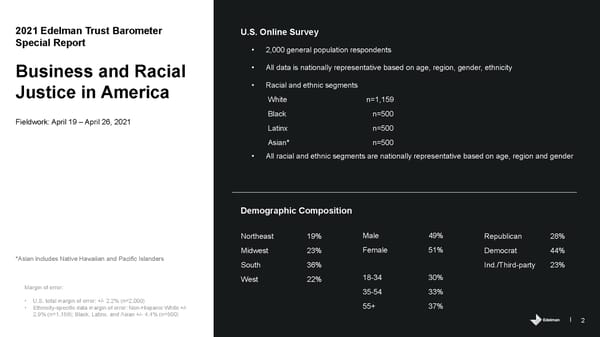
2021 Edelman Trust Barometer U.S. Online Survey Special Report • 2,000 general population respondents Business and Racial • All data is nationally representative based on age, region, gender, ethnicity Justice in America • Racial and ethnic segments White n=1,159 Black n=500 Fieldwork: April 19 – April 26, 2021 Latinx n=500 Asian* n=500 • All racial and ethnic segments are nationally representative based on age, region and gender Demographic Composition Northeast 19% Male 49% Republican 28% Midwest 23% Female 51% Democrat 44% *Asian includes Native Hawaiian and Pacific Islanders South 36% Ind./Third-party 23% West 22% 18-34 30% Margin of error: 35-54 33% • U.S. total margin of error: +/- 2.2% (n=2,000) 55+ 37% • Ethnicity-specific data margin of error: Non-Hispanic White +/- 2.9% (n=1,159); Black, Latinx, and Asian +/- 4.4% (n=500) 2
 Business and Racial Justice in America Page 1 Page 3